Watch a run
While an epic runs, every interface shows the same live state: which agent is working, who handed over to whom, what each session said, and what the run has spent.
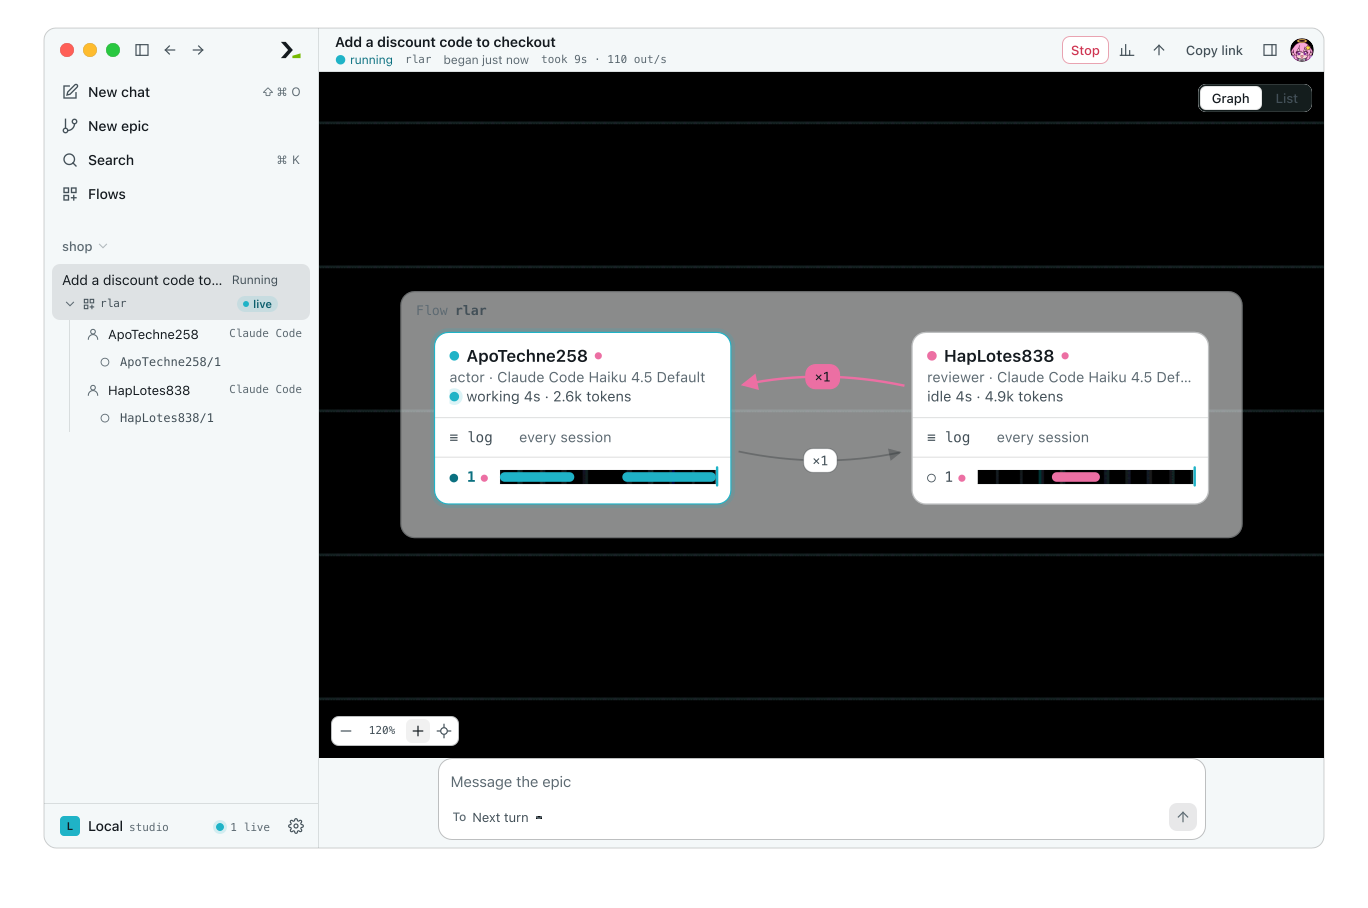
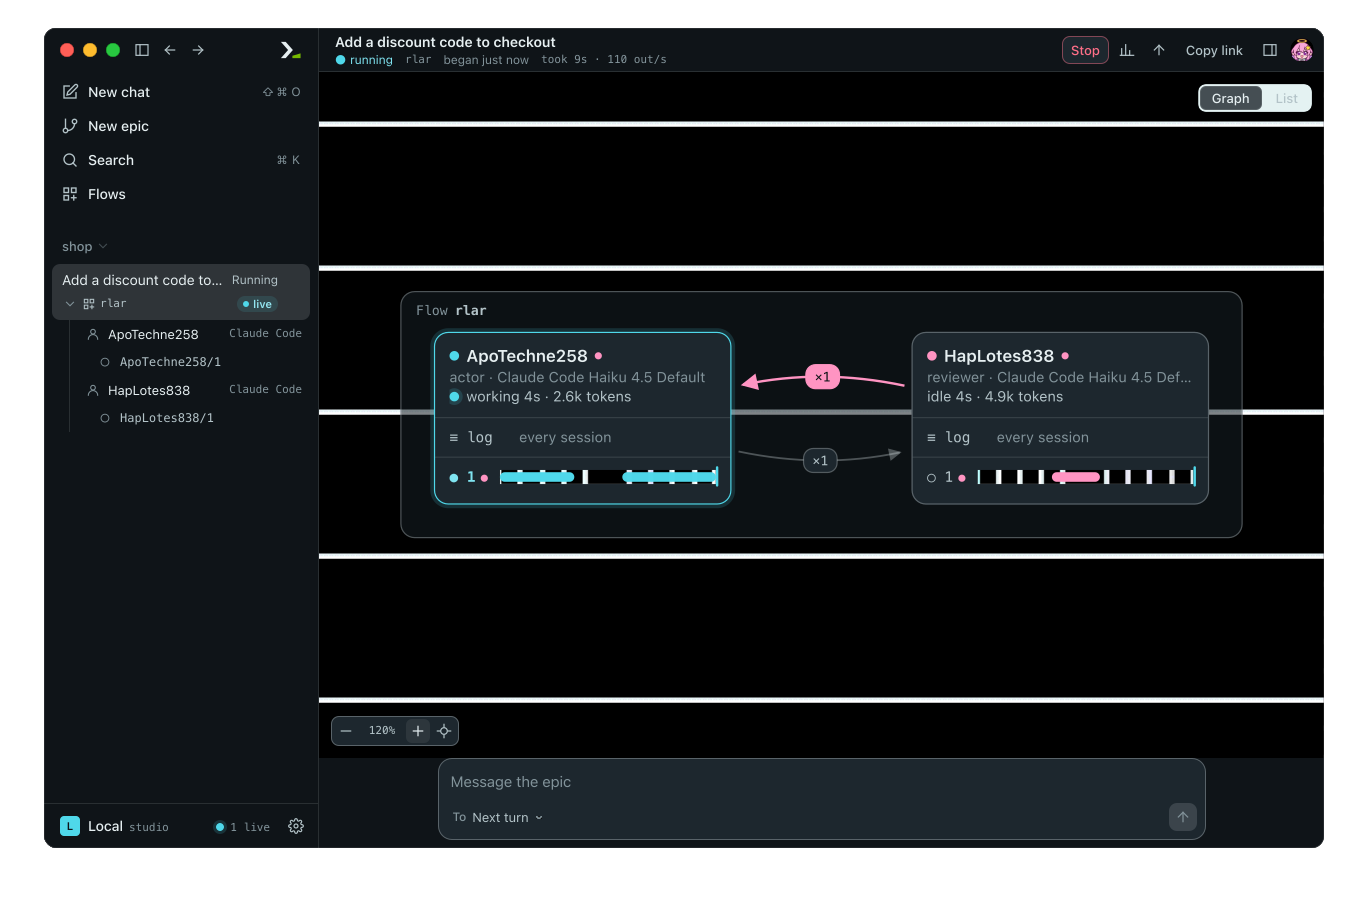
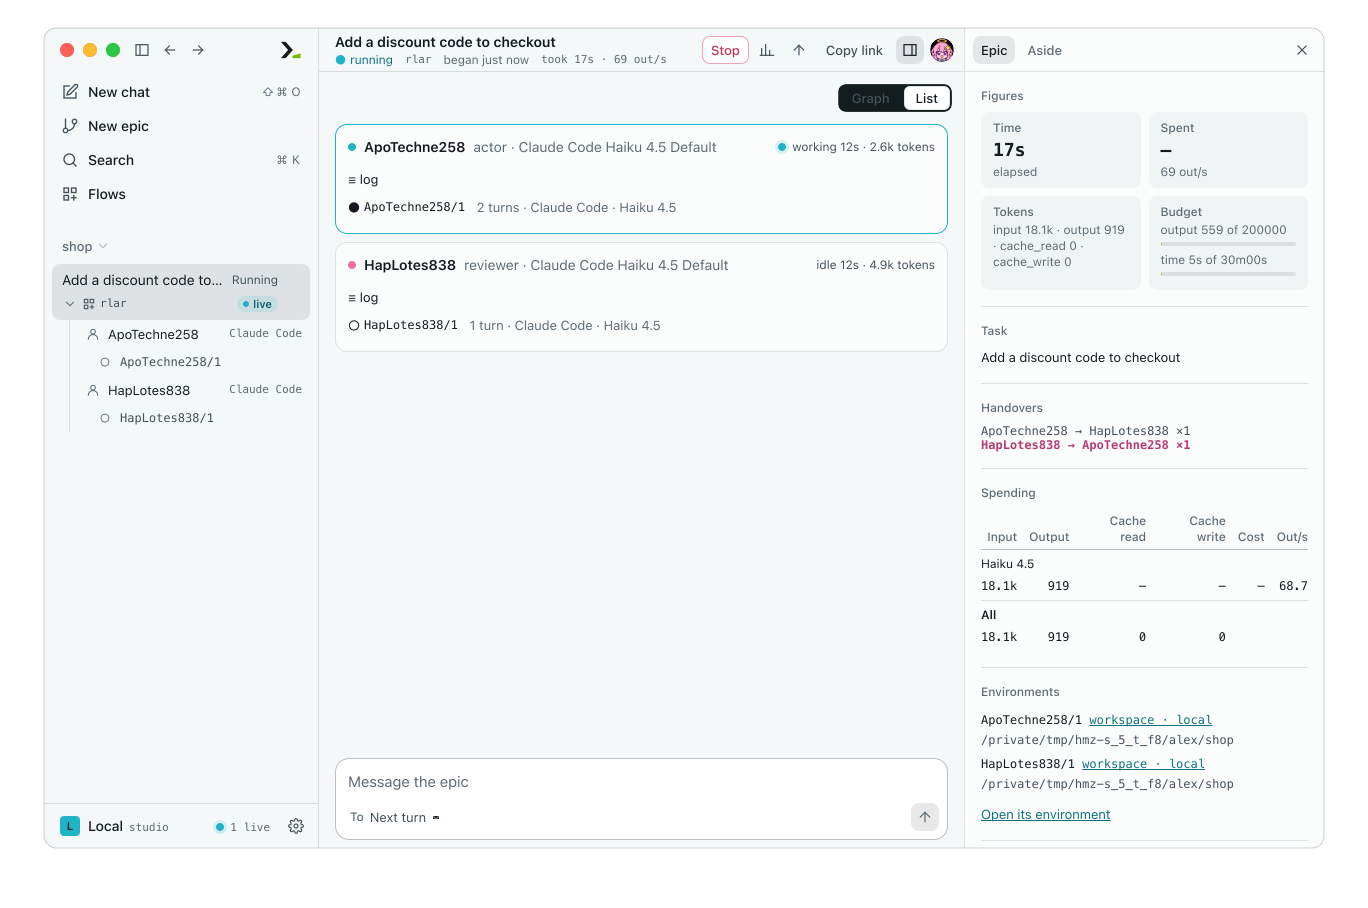
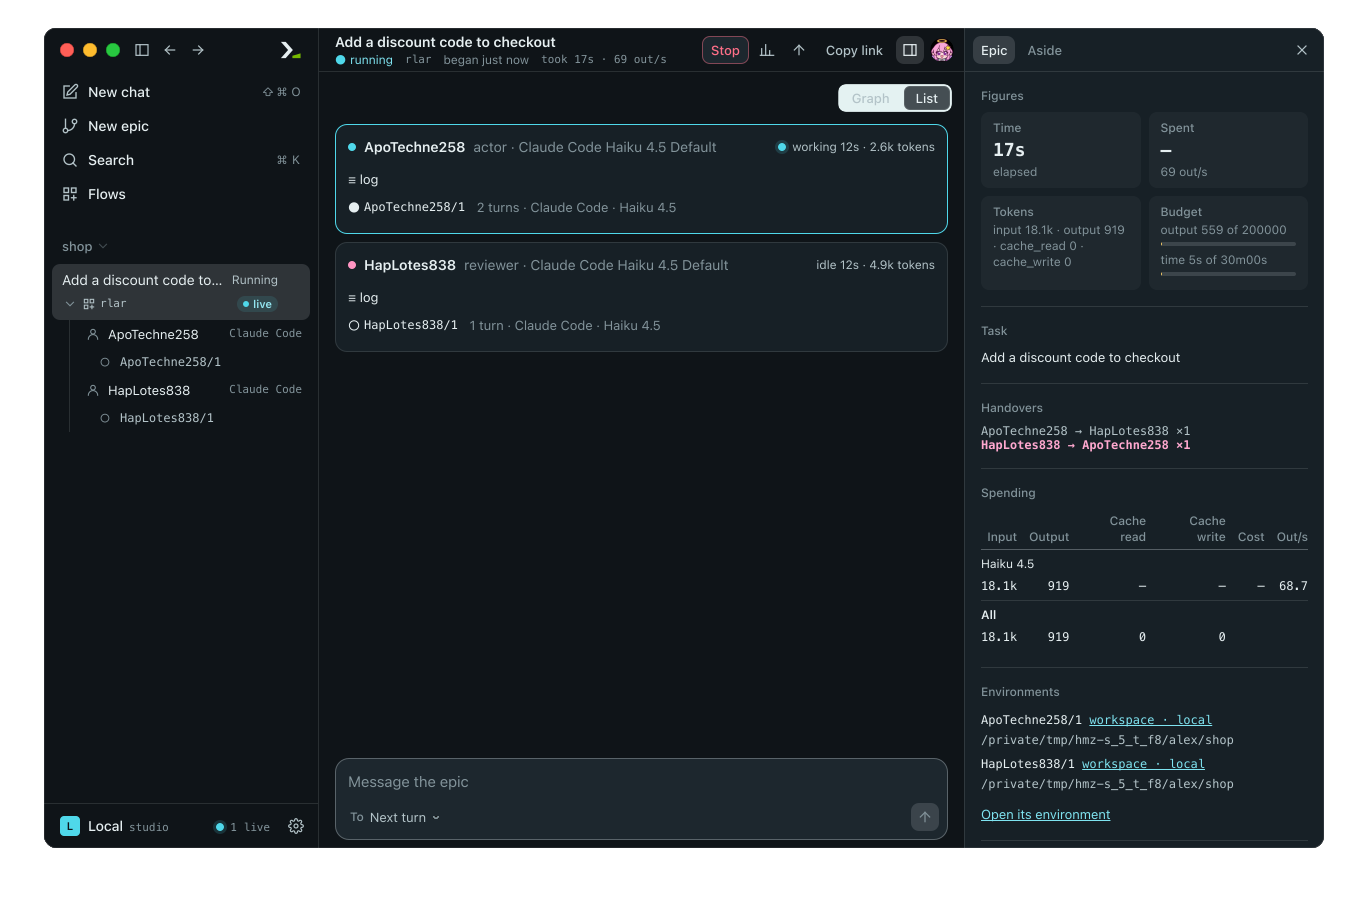
An epic in its second round: the actor is working, the reviewer has read once.
In the app
Click a running epic in the sidebar. Humanize Desktop and the web page show the same view.
Read the graph
The top bar shows the task, a state badge (running, asking, waiting, stopping, or how it ended), the flow, start time, elapsed time, and rate or spend.
Below the bar, the epic is drawn as a graph:
- A frame labelled
Flowaround the agents. Once the epic has ended, each called flow that opened agents of its own gets a frame, labelledCalled. - A node per agent and per person. A node shows the agent's name, role, what it runs,
workingoridlewith a time, and its tokens. An agent that has not taken a turn saysnot started. - A row per session inside the node. The row is a timeline over the run with a capsule per turn. Hover over a capsule to see the turn number, start time, and duration. A dot marks a session with unread lines.
- An arrow per handover direction, labelled with a count such as
×2. The latest handover is highlighted.
Unless the flow names an agent, the run assigns a unique codename: a generated word, usually ending in digits, such as KykLos204 or Golem99. Every interface shows the codename followed by the agent's role, such as actor. Sessions are numbered under the agent's name as <agent>/<n>, such as KykLos204/1.
The graph opens fitted to the view. Zoom ranges from 20% to 300%.
| To | Do |
|---|---|
| Pan | Drag anywhere, or slide two fingers on a trackpad |
| Zoom | Pinch, turn the mouse wheel, or press Zoom in and Zoom out |
| Fit it again | Press Recenter |
| Show it at 100% | Right-click the canvas and choose Actual size |
Pick out an agent
Click the head of a node to centre the graph on that agent. A section for it opens at the top of the Epic panel with its role, what it runs, status, turns, tokens, a link to each session, and the subagents it started.
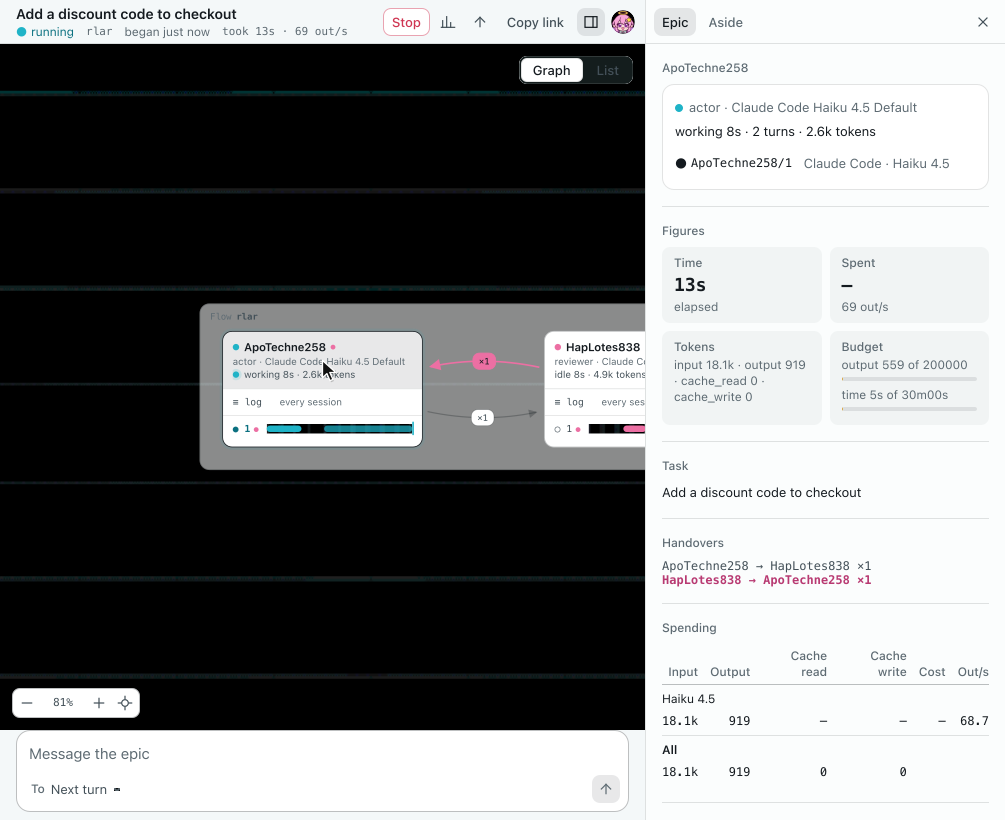
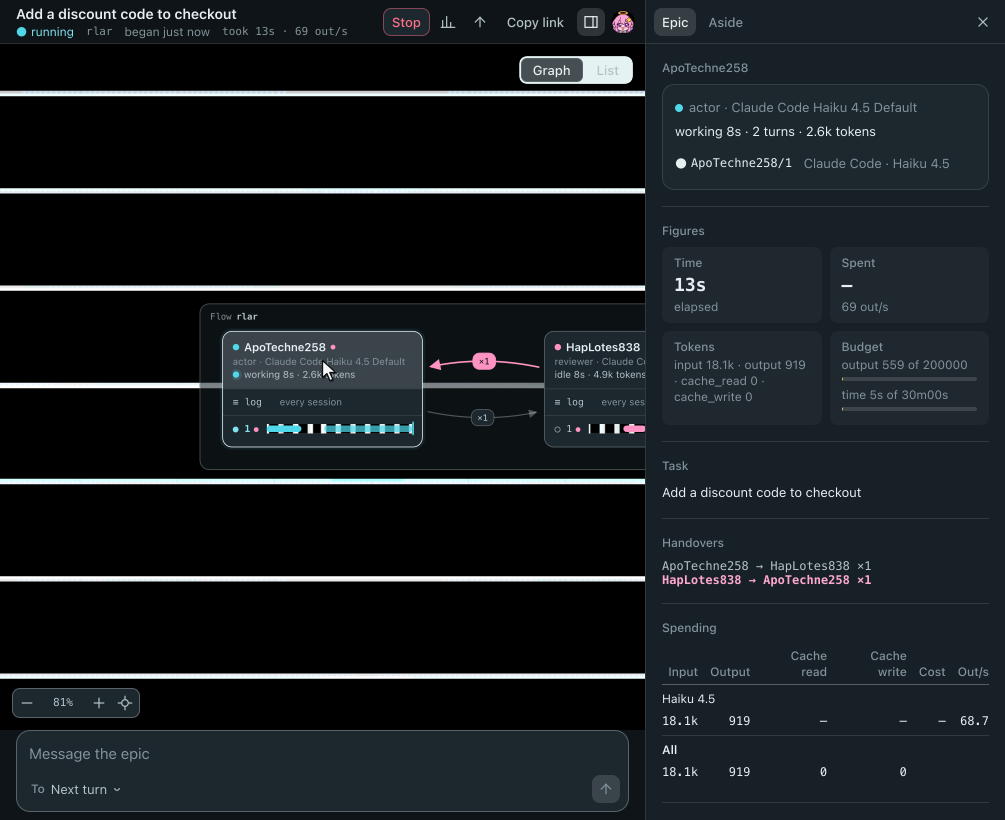
Right-click a node for the same actions in a menu: Pick out, Open log, one entry per session, and Copy agent. Right-click a session row for Open and Copy link. The sidebar lists the epic's agents and their sessions: click an agent to pick it out, or click a session to read its thread. An agent's menu there has Show on graph.
You cannot pick out a person's node. Click it to see what that person was asked and answered.
Read what an agent said
Click a session row to read that session as a thread, or click ≡ log to read all sessions of one agent in one thread. The top bar becomes a breadcrumb; click the task to return to the graph.
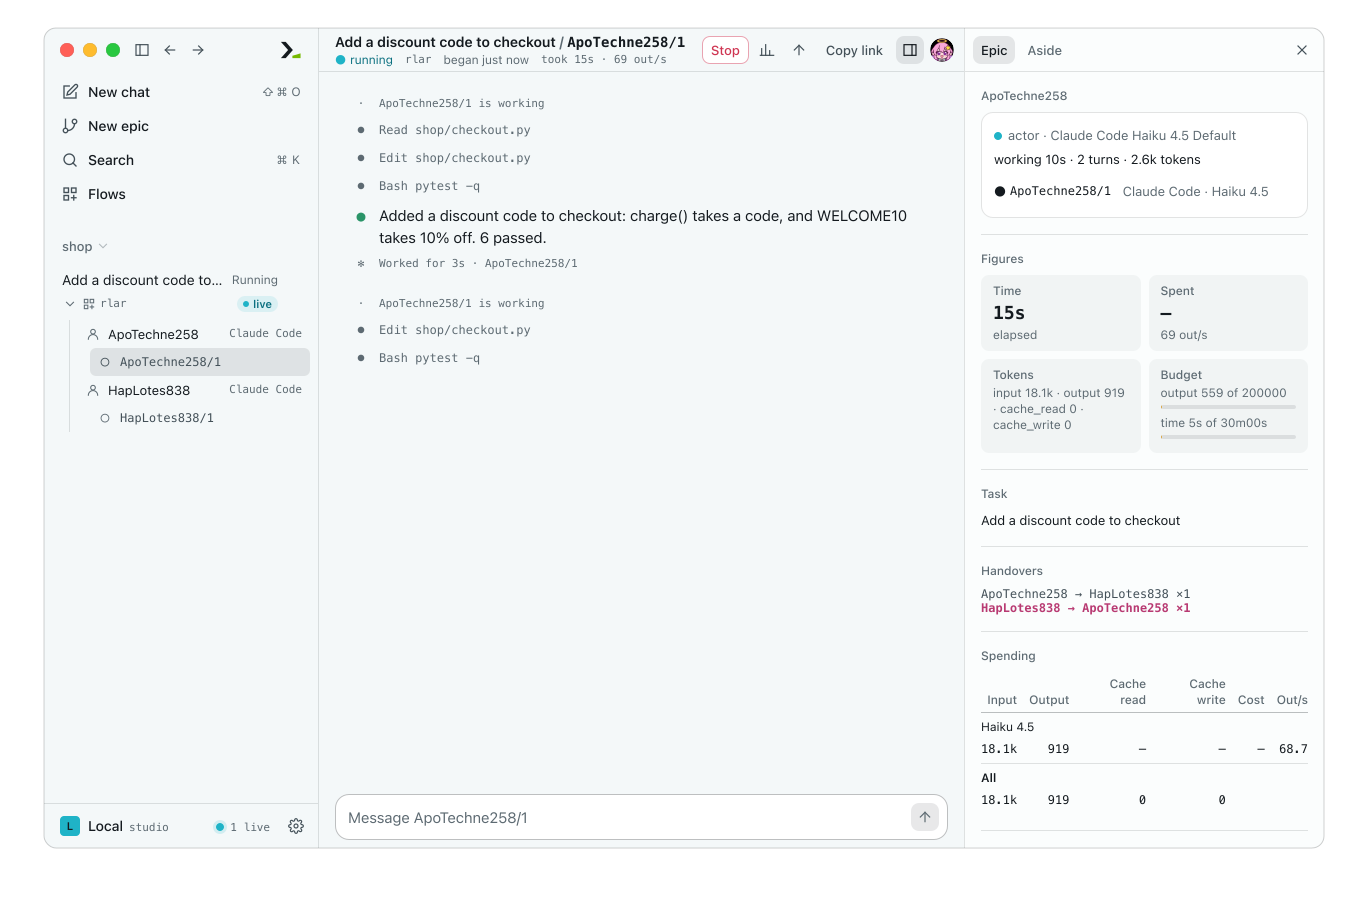
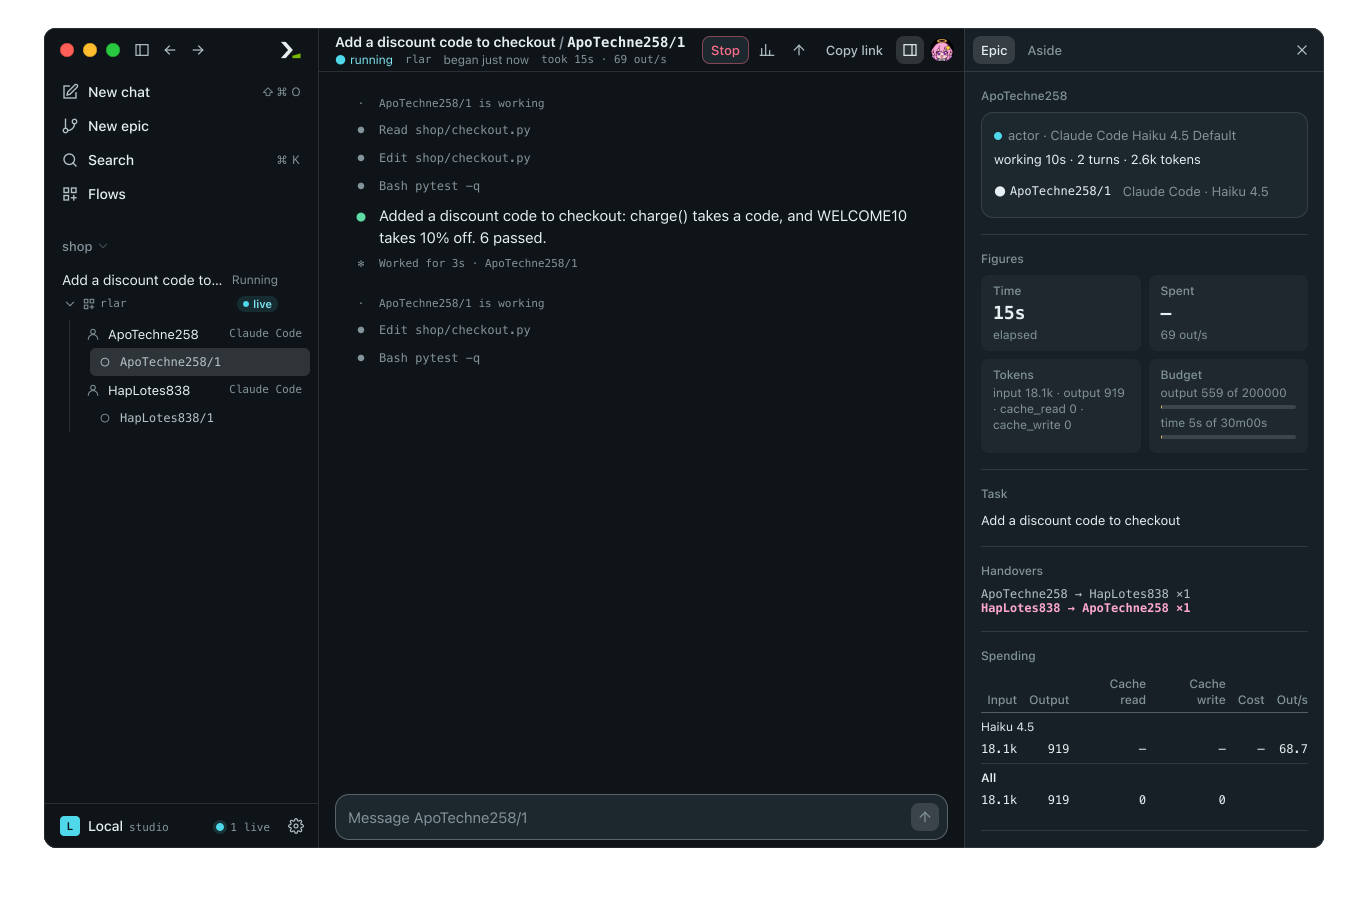
A thread shows when a turn starts, each tool call, the agent's answer, and the turn duration. A thread scrolled to the bottom stays pinned there as new lines arrive. Opening a session marks it read. A thread also dimly shows any action a person took in the epic's environments, inline where it happened.
Switch to a list
Press List in the corner of the view to show agents as a list. Working agents appear first, each with its ≡ log link and sessions. Press Graph to switch back. The browser remembers your choice.
Read the figures in the Epic panel
Click the panel button on the right of the top bar to open or close the summary panel. Its Epic tab has these sections:
| Section | What it shows |
|---|---|
| Figures | Time elapsed, money spent and rate, tokens by kind, and a meter for each budget limit |
| Task | The task the epic was given |
| Handovers | Each direction and its count, the latest marked |
| Spending | A row per model: tokens of each kind, Cost and Out/s, and a total row |
| Environments | Where each session works, with a link to open that environment |
| Done in its environments | The last 8 things a person did in those environments |
| Frontends | Every interface attached to the run |
| Running flows | The flows running now, as a tree, with their time |
| Setup | The epic's name, where it is written, workdir, agents, environments, params, budget and sessions |
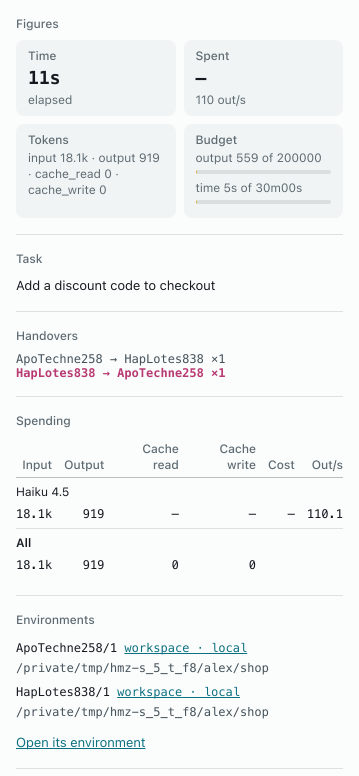
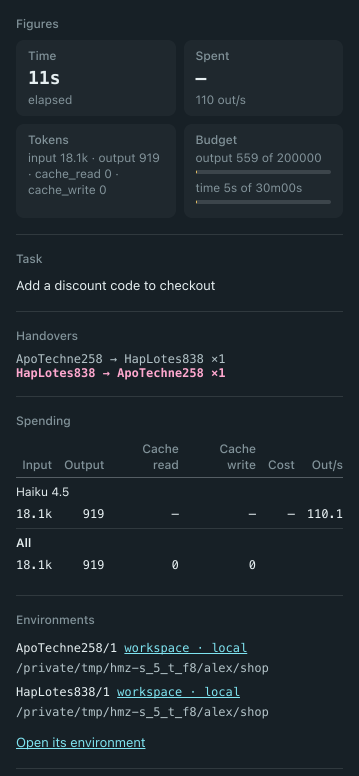
When an epic ends, the Epic panel updates. Figures shows money spent, output tokens, duration, and session count. Called flows replaces Running flows and shows the tree of every flow the epic called. When they apply, Setup also shows resumed from (a link to the epic this one picked up from) and profiled (flow, environment, or both).
Click a task longer than 400 characters to unfold it. Right-click a path in the panel and select Copy path.
See Ask a side question for Aside, Talk to a running flow for Board, and Answer a flow's questions for People.
In the terminal
Start the flow in hmz. Watch it in the log (one agent's transcript) or the monitor (the whole run).
Read the log
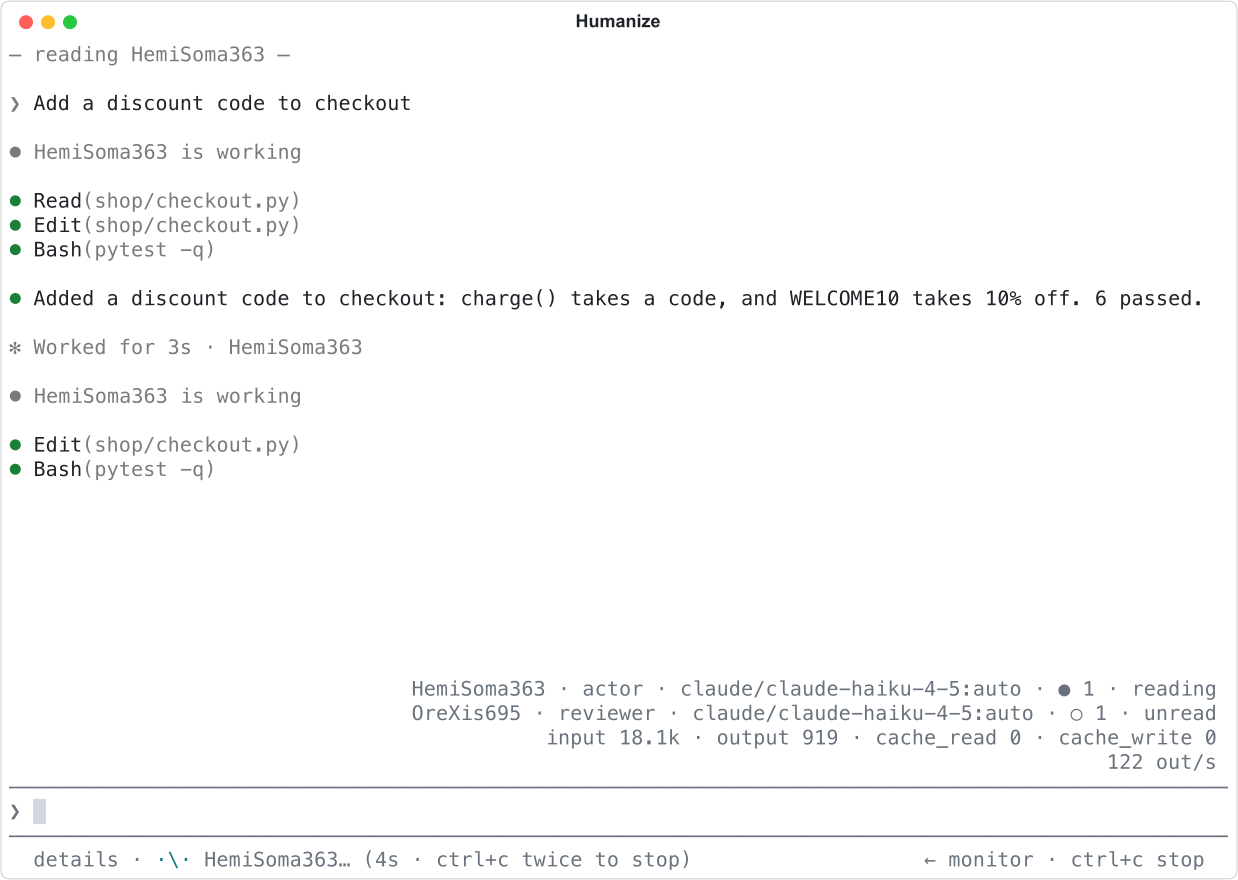
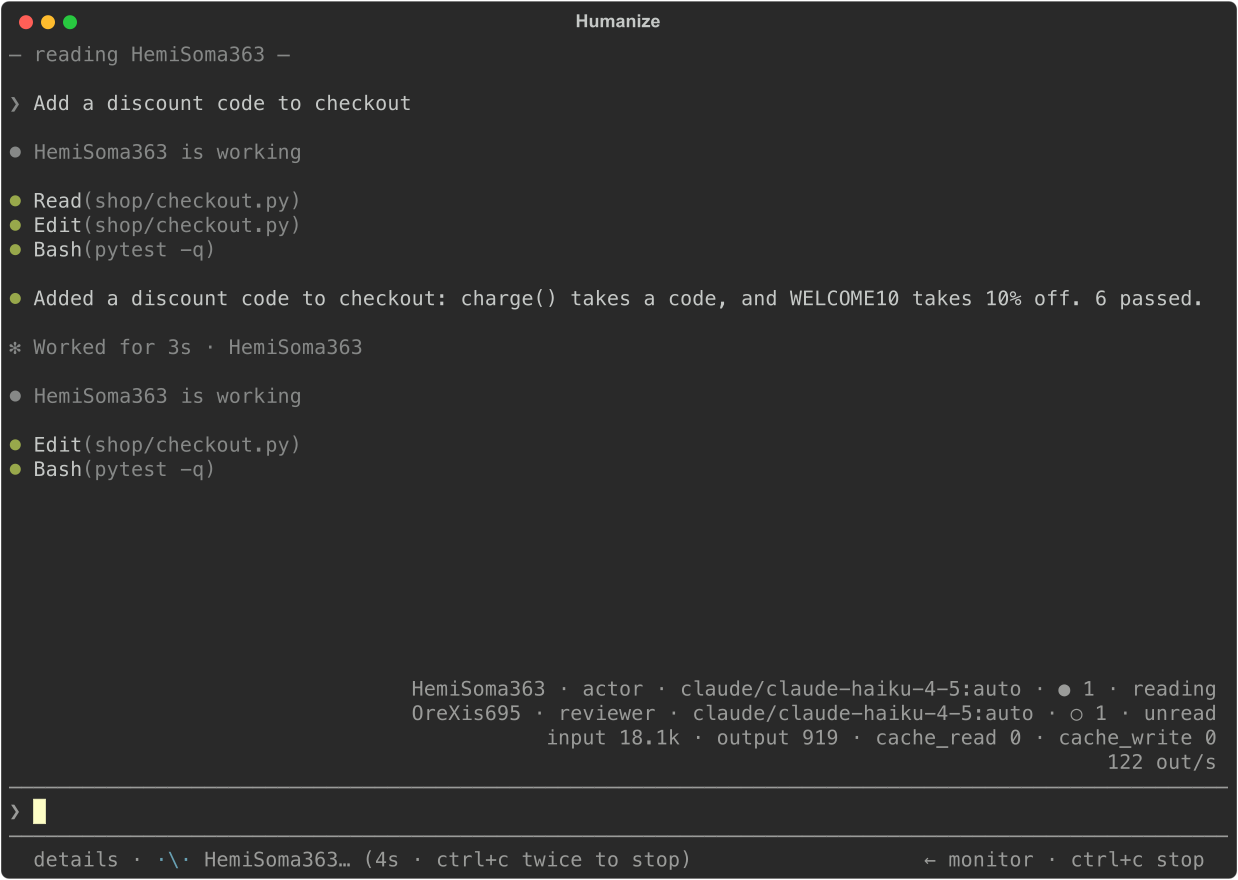
The log shows one view at a time: an agent, a session, or a person's role. Each turn appears as lines:
<agent> is working(dim) when a turn starts.- The agent's output, with a green bullet.
- A notice or question, with a yellow bullet.
- A failed turn, in red.
Worked for <time>(dim) when the turn ends.
Above the prompt, each agent has a summary line: name, role, what it runs, session count, and reading (current view) or unread (unseen lines). Below that, once tokens are spent, two lines show tokens by kind, money spent, and output rate.
Press shift+tab to jump to the next view with an open turn, and tab for the previous one.
To show tool calls, thinking, subagents, and harness output, open /settings general and turn on Details. The status line then shows details.
Open the monitor
Press ← on an empty prompt to open the monitor. Press → to return to the log.
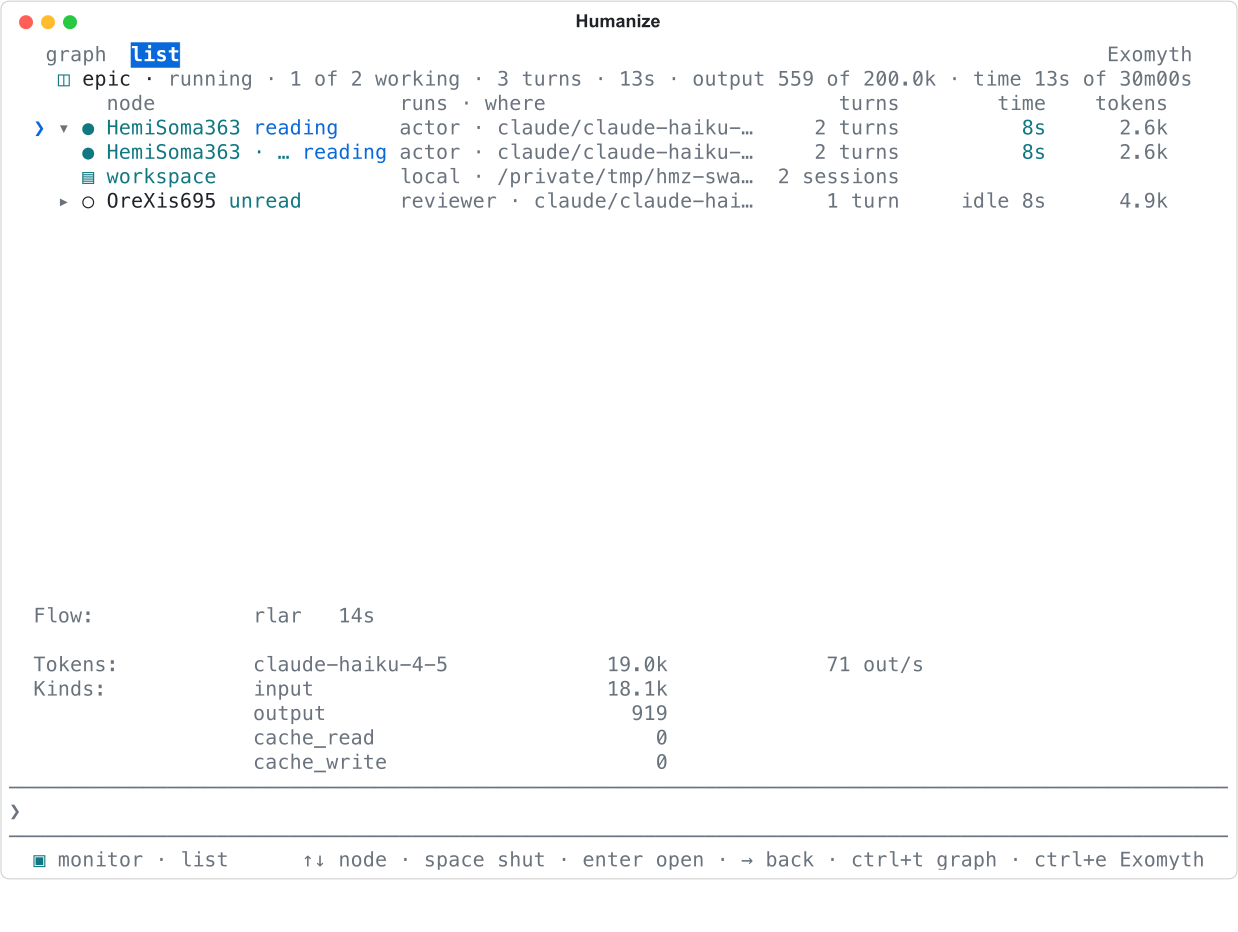
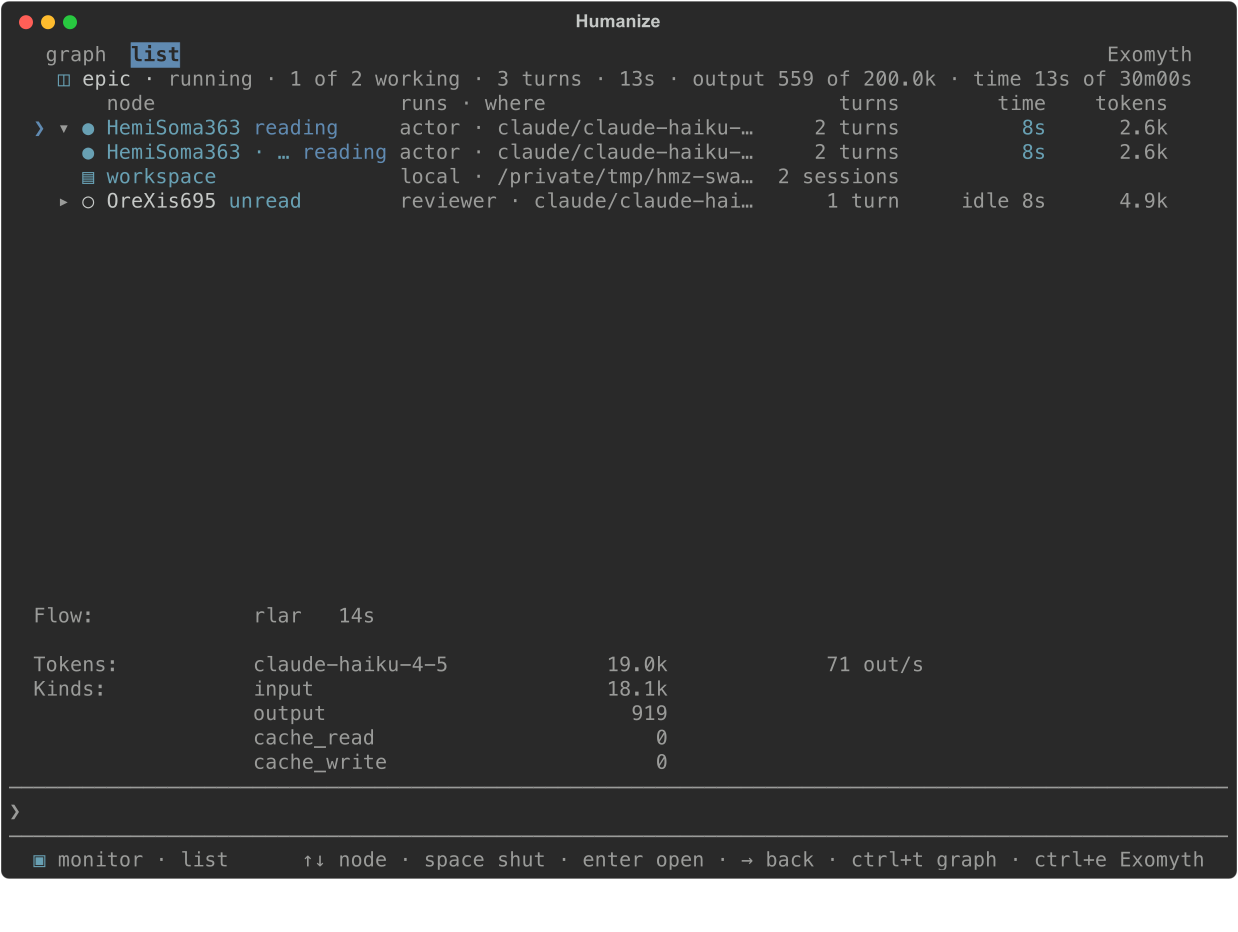
The first row shows the epic: state, active agent count, turns taken, time elapsed, and budget limits against current spend. Below it, each agent that has taken a turn has a box in the order the flow ran them.
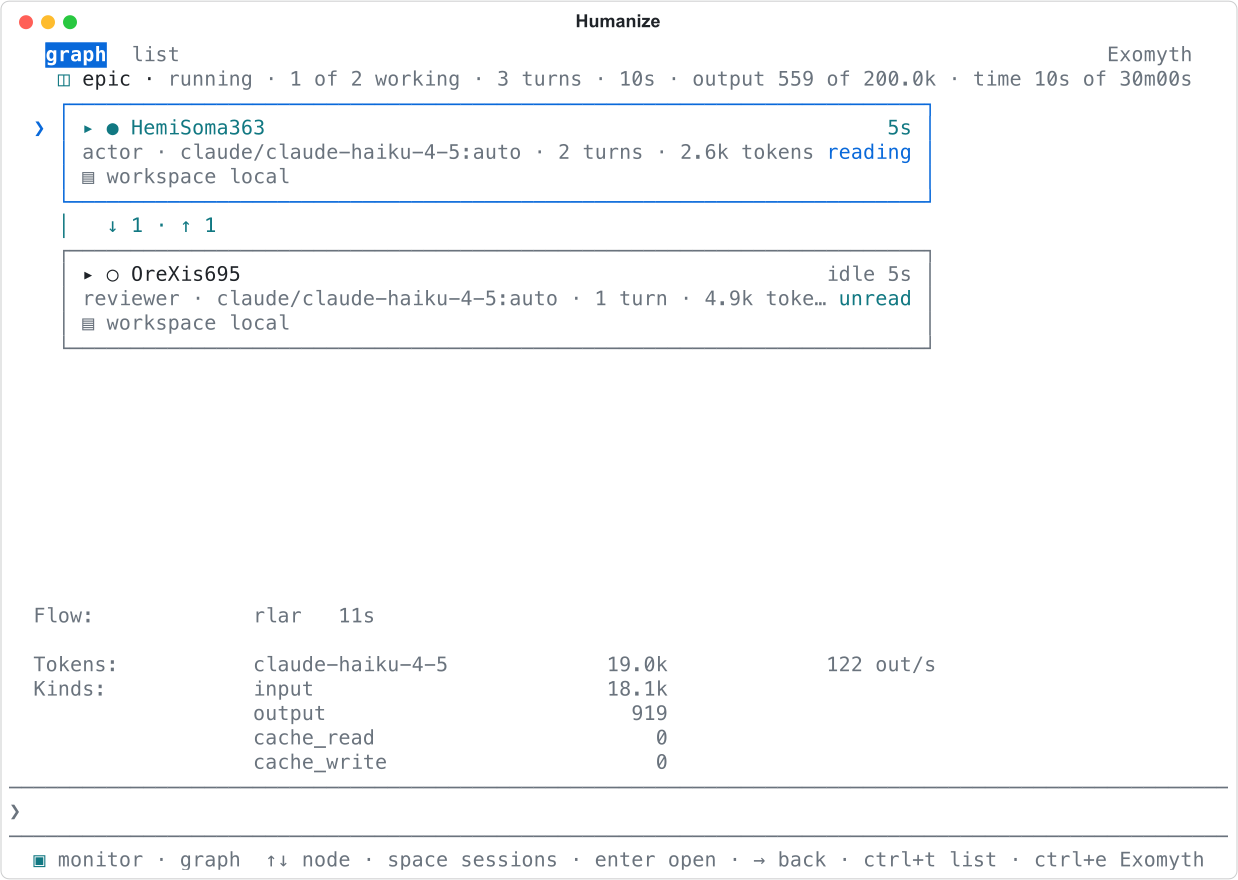
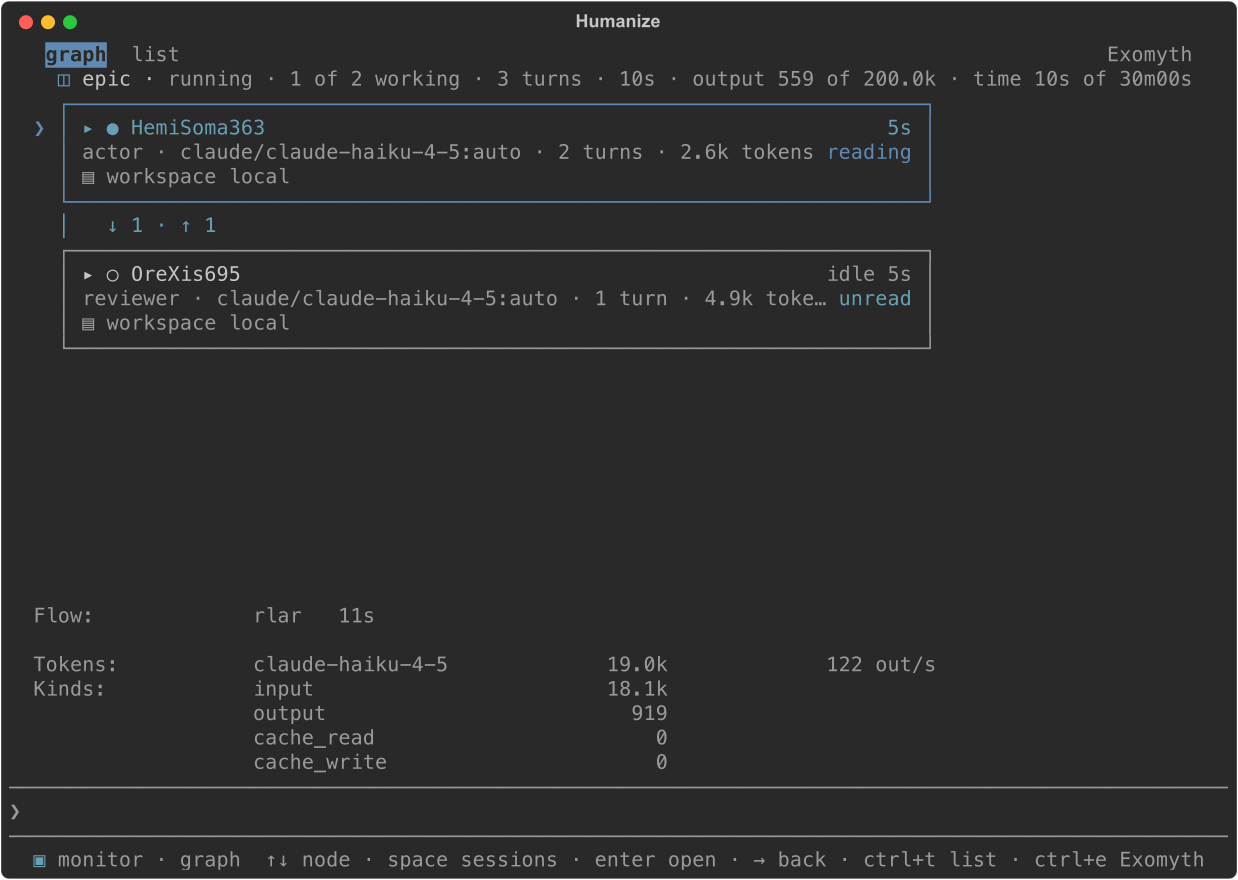
A box shows ● (working) or ○ (idle), the agent's name, and a clock for the open turn's duration or idle with the time since the last turn. The second line shows role, what it runs, turns, tokens, and reading or unread. The third line names its environments. Between boxes, ↓ 1 · ↑ 1 counts handovers each way.
| Key | What it does |
|---|---|
| ↑ ↓ | Move to the previous or next node |
| enter | Open the node: an agent or session opens its log, an environment its page, the epic row the epic page |
| space | Open an agent out to its sessions, or shut it |
| ctrl+t | Switch between graph and list |
| ctrl+e | Open the epic in Exomyth (see Trace a run with Exomyth) |
| → | Go back to the log |
You can also use the mouse: click an agent's box to select it, double-click to open it, click its left edge to expand or collapse it, click any other row to open it, and click graph, list, or Exomyth at the top.
An expanded agent shows a branch per session with turns, tokens, clock, and environment. Subagents started by an agent appear under it, marked ◆ while working and ◇ when done. The monitor lists the first 4 and counts the rest.
The list view shows the same nodes as a table with columns node, runs · where, turns, time, and tokens. Working nodes appear first, without handovers.
Below the graph, the monitor shows run details:
| Line | What it shows |
|---|---|
Flow | The flow running and any flow it called, with their time |
Agents | What each role runs, until the first agent works |
Set | The params changed from their defaults |
Reading | The other interfaces on the run, when there is more than one |
Also | Handovers between agents that are not neighbours |
Tokens | A line per model: tokens, money and output tokens per second |
Kinds | Tokens by kind |
The prompt remains at the bottom of the monitor. When you type, keys go to the prompt instead of the monitor, except ctrl+t.
A person's role appears as a node above the agents, and a board has a node per line. See Answer a flow's questions and Talk to a running flow.
Open the epic page or an environment
- In the monitor, select the first row and press enter to open the epic page. It shows figures, budget meters, setup details, running flows, and a Stop button (see Stop a run).
- Press esc to return to the monitor.
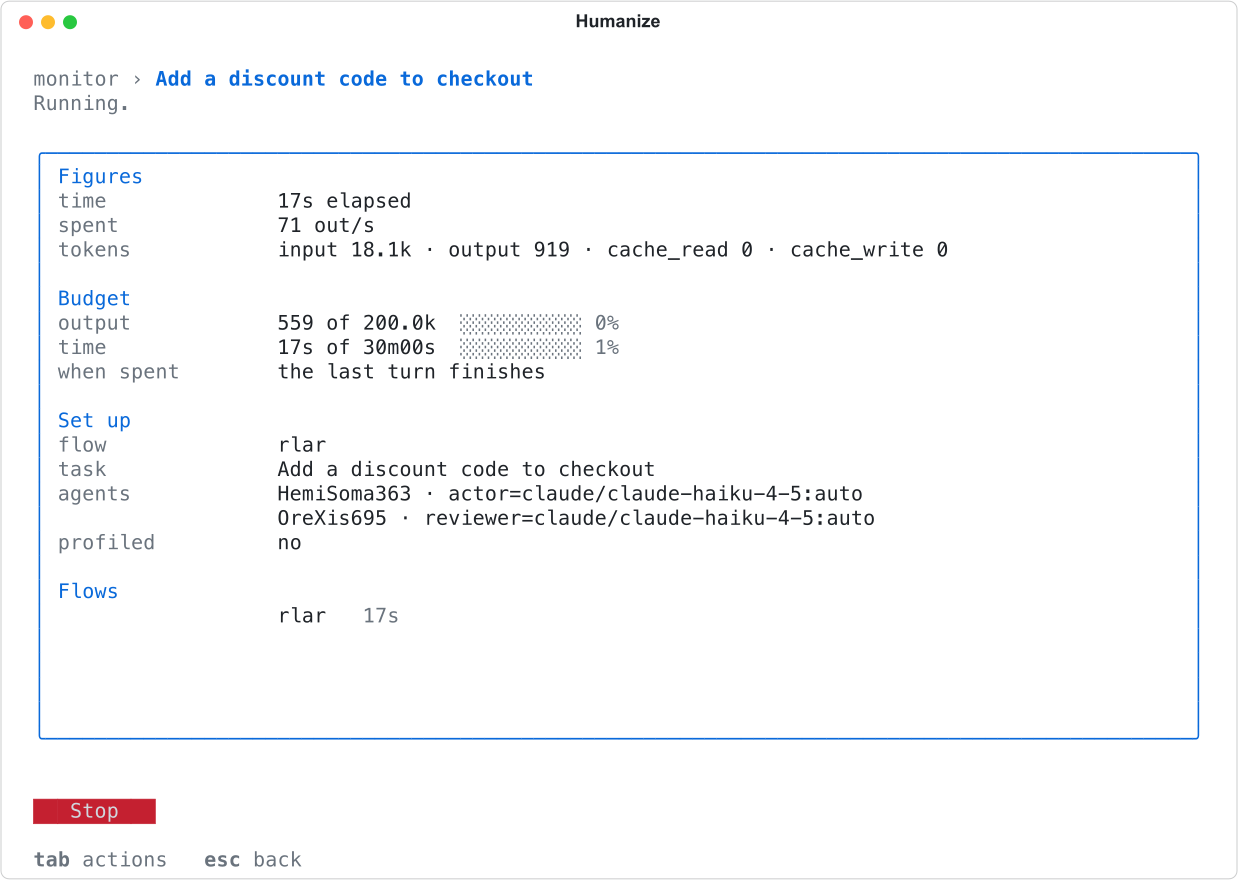
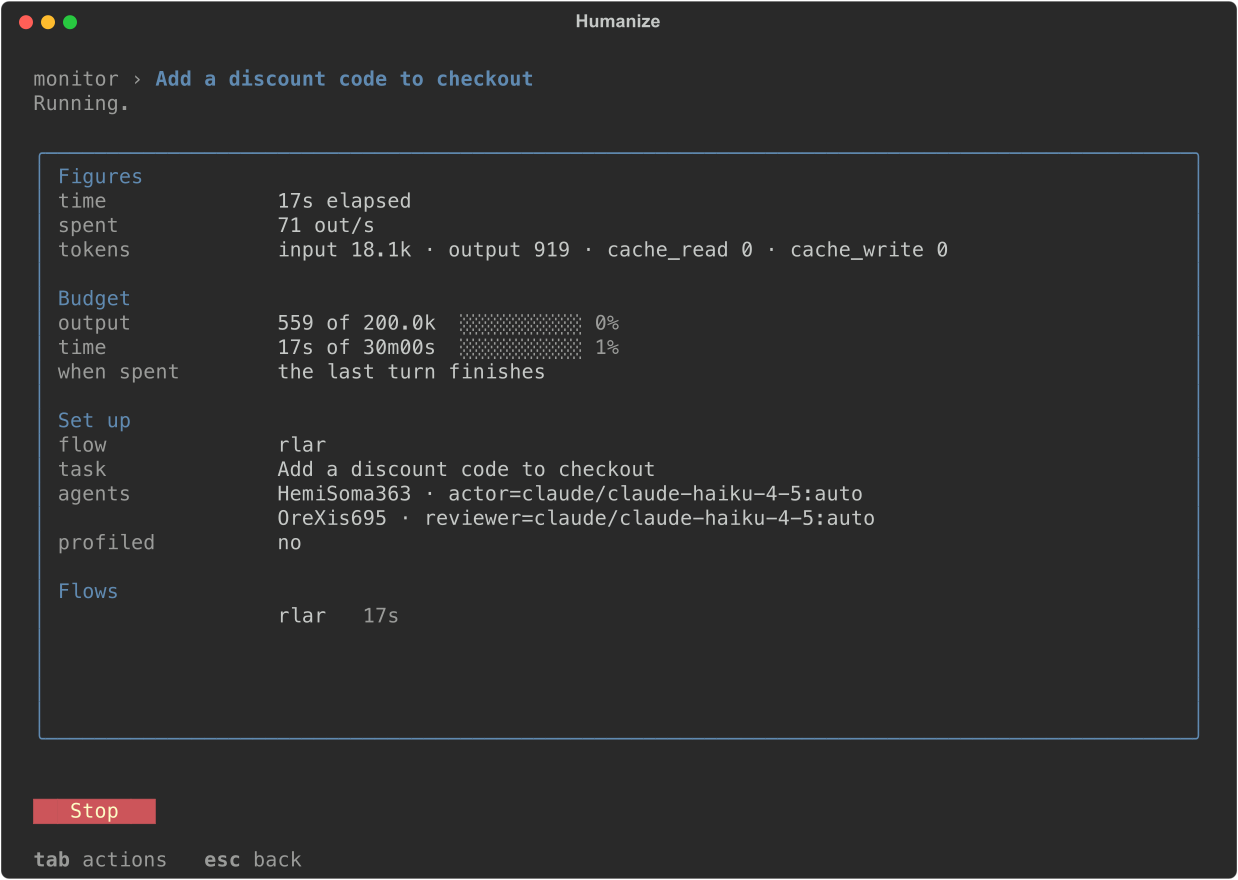
Press enter on an environment row to see its kind, target, workdir, grants, harness location, status, and sessions, plus what it was set up as, its image, and its needs when set. Press enter on a session there to read its log.
From the command line
hmz exec prints the run as it goes: a line when an agent starts, its tool calls, its answer, and the turn's spend and duration.
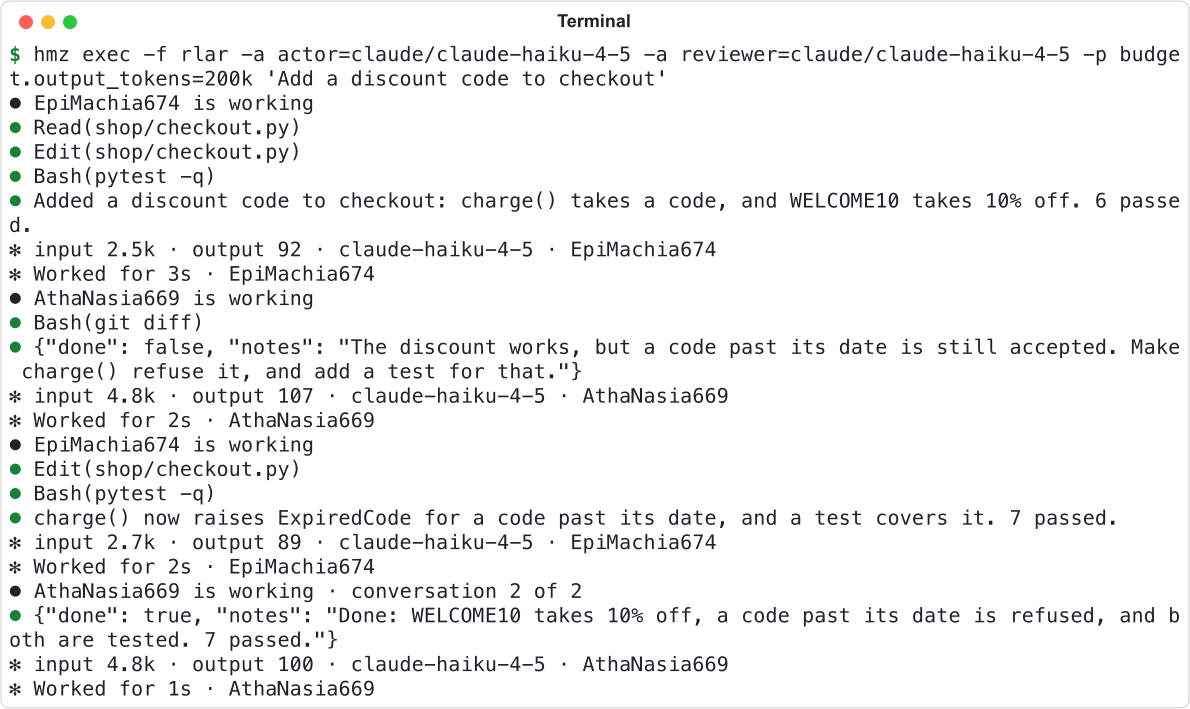
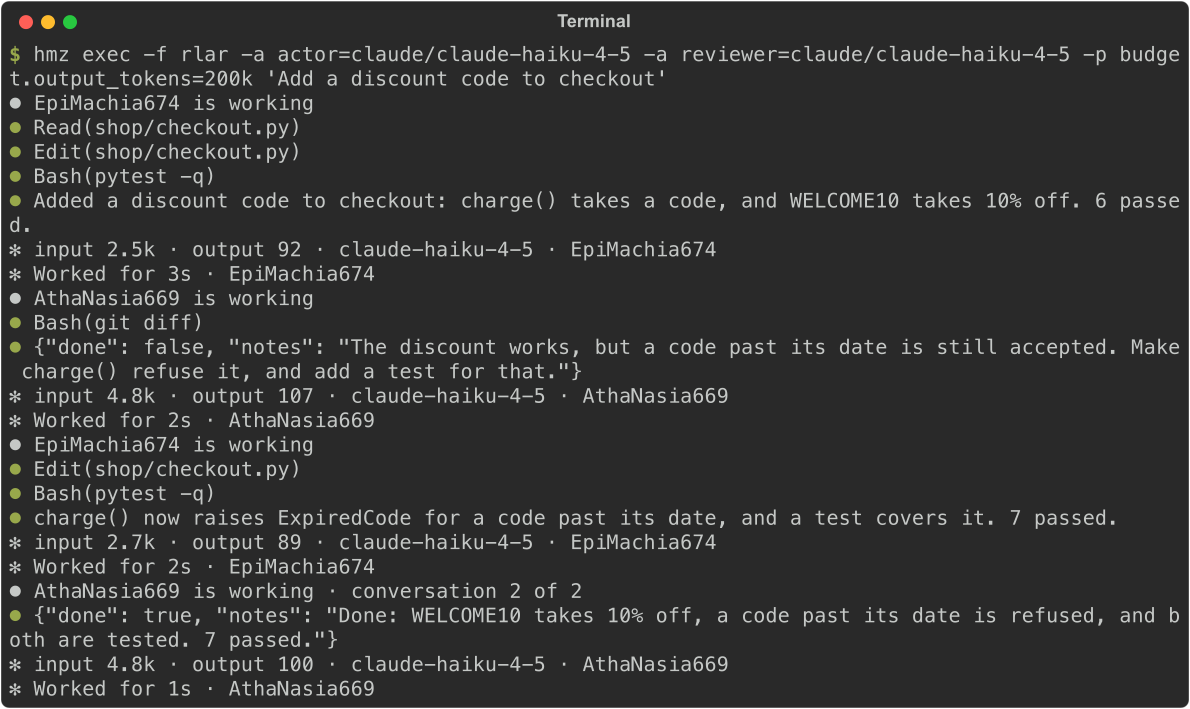
The summary line after each answer shows tokens by kind, model, agent, and cost (if the model has a price). For streams, --json, and exit statuses, see The command line.
How spending is counted
Humanize reads spend from each coding agent's log while the turn runs, updating at least every five seconds.
- Tokens are counted separately by kind: input, output, cache read, cache write, and reasoning. They are never summed into one total.
- Rate is output tokens per second over the last five minutes.
- Cost appears only for priced models. Unpriced models show no cost, rather than
$0.00. - When a coding agent omits a token kind, the figure is marked as a minimum:
+in the terminal,≥in the app.
See Budgets for limits and Cost and usage for totals by day and flow.
Good to know
- The monitor is only for epics. In a chat, ← does not open it.
- An agent appears in the terminal monitor once it starts its first turn. Until then, the monitor says
no agent has taken a turn yet; agents appear as they take turns. - The terminal forgets your graph or list choice and expanded agents when you quit
hmz. - A thread in the app renders at most the last 3000 lines, though the epic stores every line.
- When an epic ends, the app reconstructs turns and handovers from the logs. If this fails, press Read turns to retry.
- To inspect a finished run, see History and search.