Cost and usage
Humanize counts the tokens every agent uses and prices them in US dollars. Watch these figures while a chat or an epic runs, or add them up afterward by day and by flow.
What is counted
Humanize reads spending from the coding agent's log during each turn and updates the figures at least every five seconds.
| Figure | What it is |
|---|---|
| Tokens | Counted per kind: input, output, cache read, cache write and reasoning. |
| Cost | US dollars at list price, per model. See Prices. |
| Rate | Output tokens per second, per model, over the last five minutes. |
| Time | How long agents worked. |
Minimum figures show + after them in the terminal and Usage popup, and ≥ before them in the app's Spending table. A token count is a minimum when a coding agent does not report that kind. A cost is a minimum when some models have a price and others have none.
In the app
Open the Usage ring
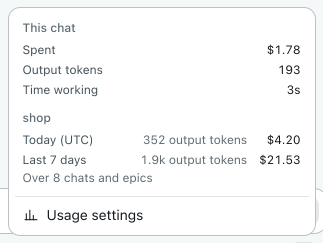
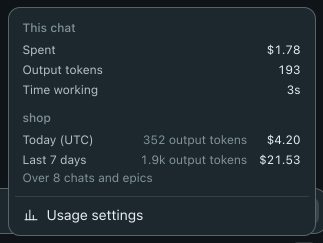
Click the ring at the end of the row under a chat's box. The popup shows:
- This chat: Spent, Tokens, Time, and each token kind with its share while the chat runs. Once the chat rests, it shows Spent, Output tokens, and Time working.
- The folder: what all chats and epics in it spent Today (UTC) and over the Last 7 days.
- Usage settings, which opens that folder's Usage page, in its Workspace settings.
On the New chat page, the ring shows only the folder's figures. With no folder picked, and in a chat that has no folder, the folder part reads Every folder and Usage settings opens the daemon's Usage page.
Watch a run
Open an epic and check the Epic tab in the side panel. Figures shows time, spent, tokens, and the budget. Spending lists one row per model with tokens of each kind, Cost, and Out/s, followed by an All row. Once the epic ends, Figures shows what it spent, its output tokens, and how long it took. In a chat, the Details pane shows the same under Usage. See Budgets for budget meters and Watch a run for the rest of the panel.
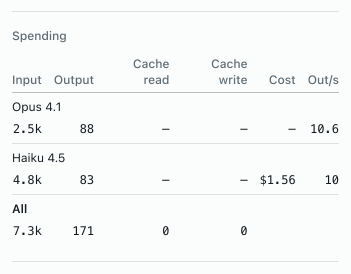
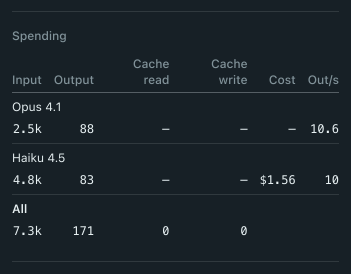
A model with no price shows a dash, not $0.
View the Usage pages
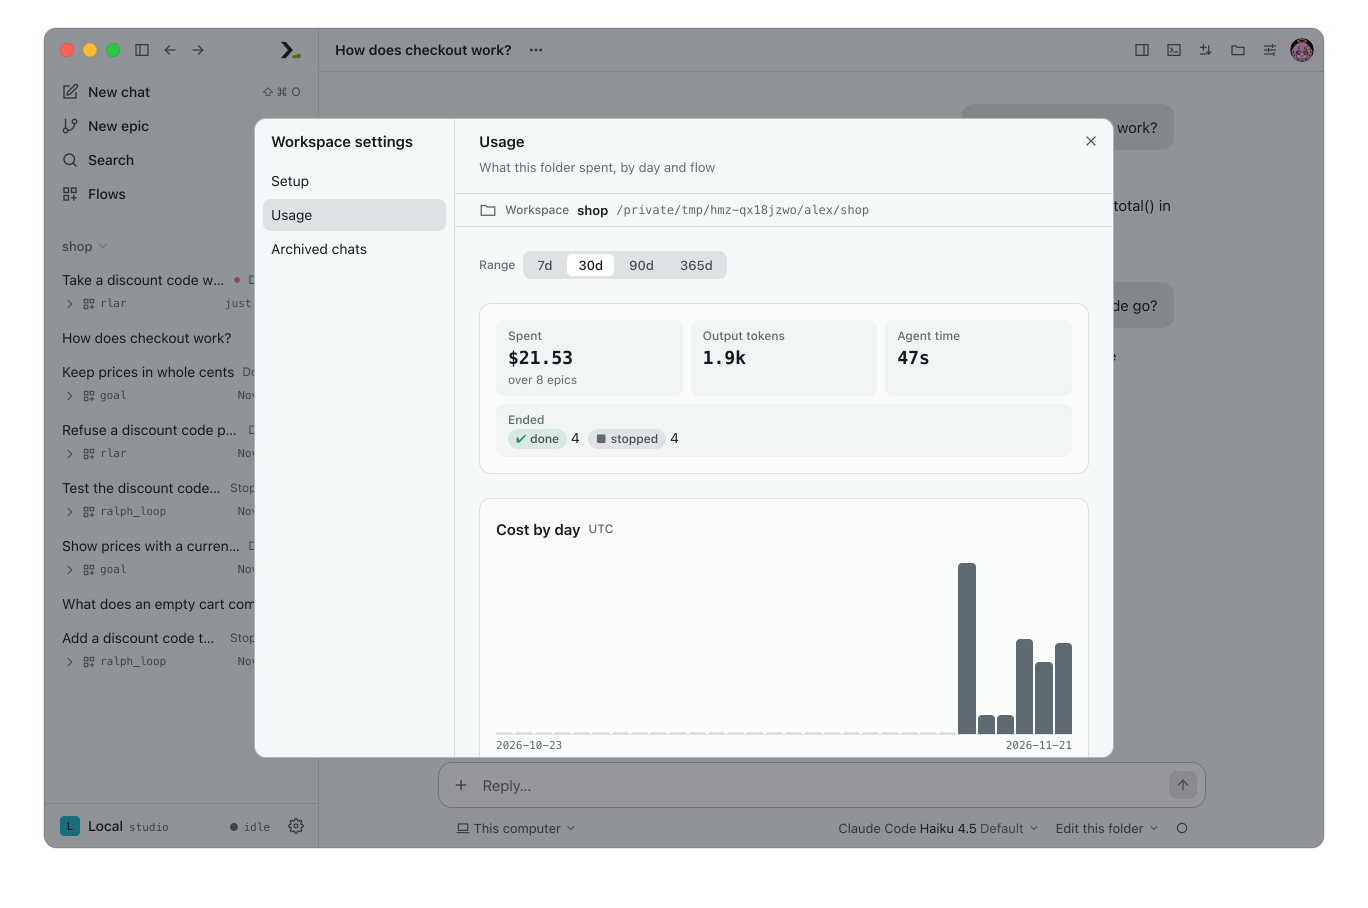
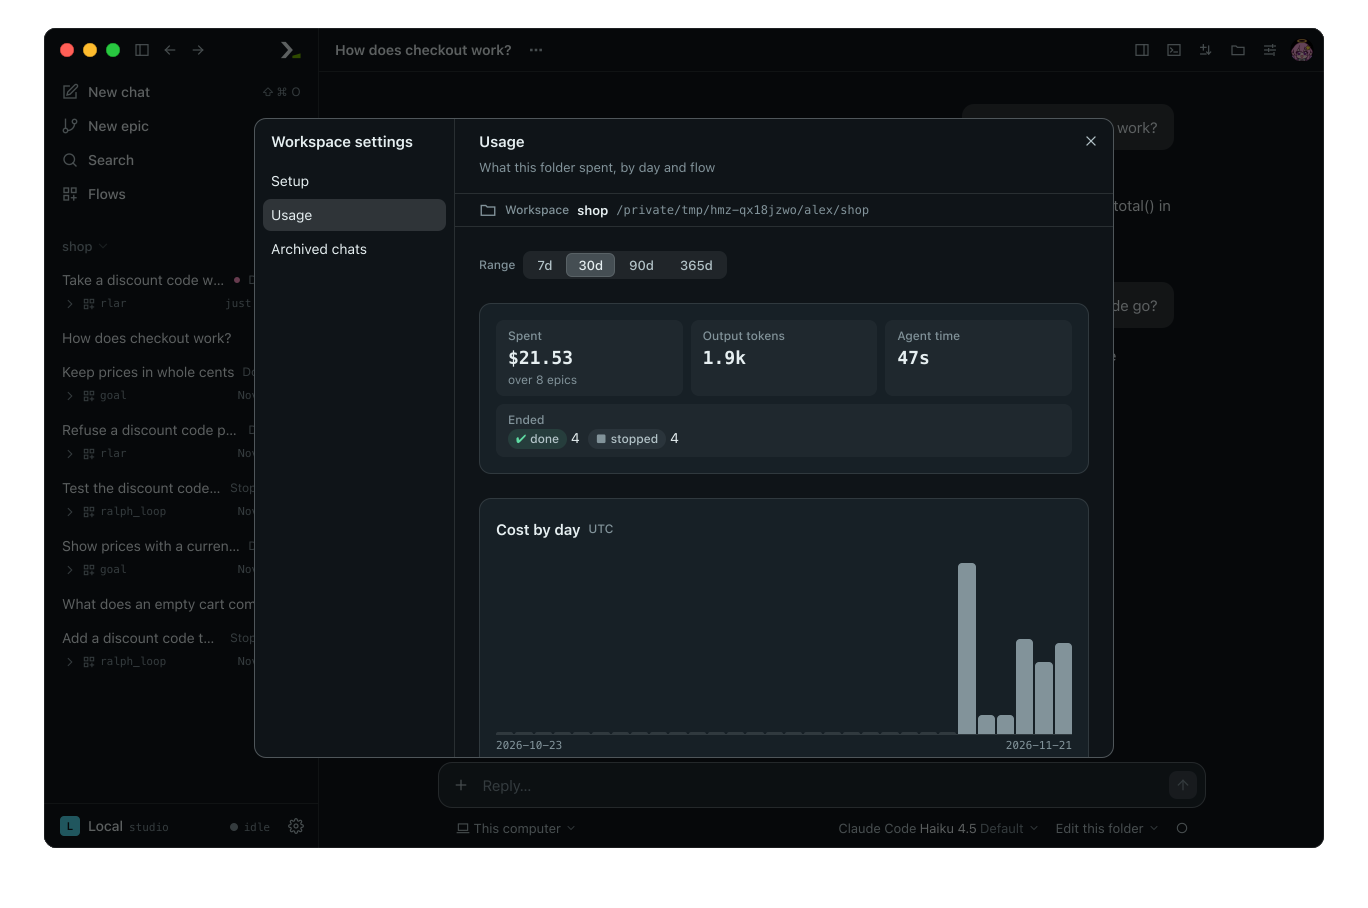
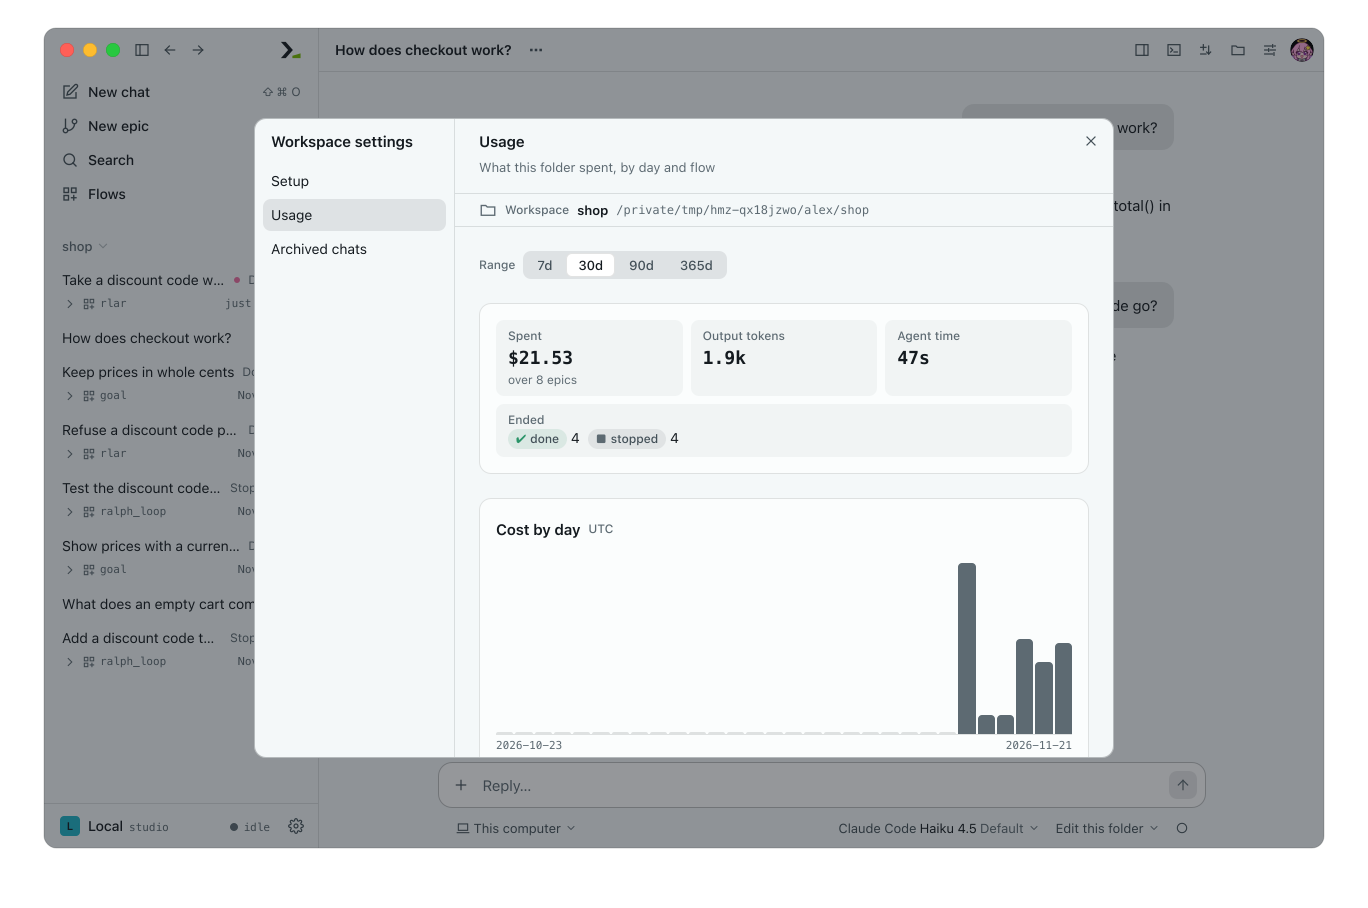
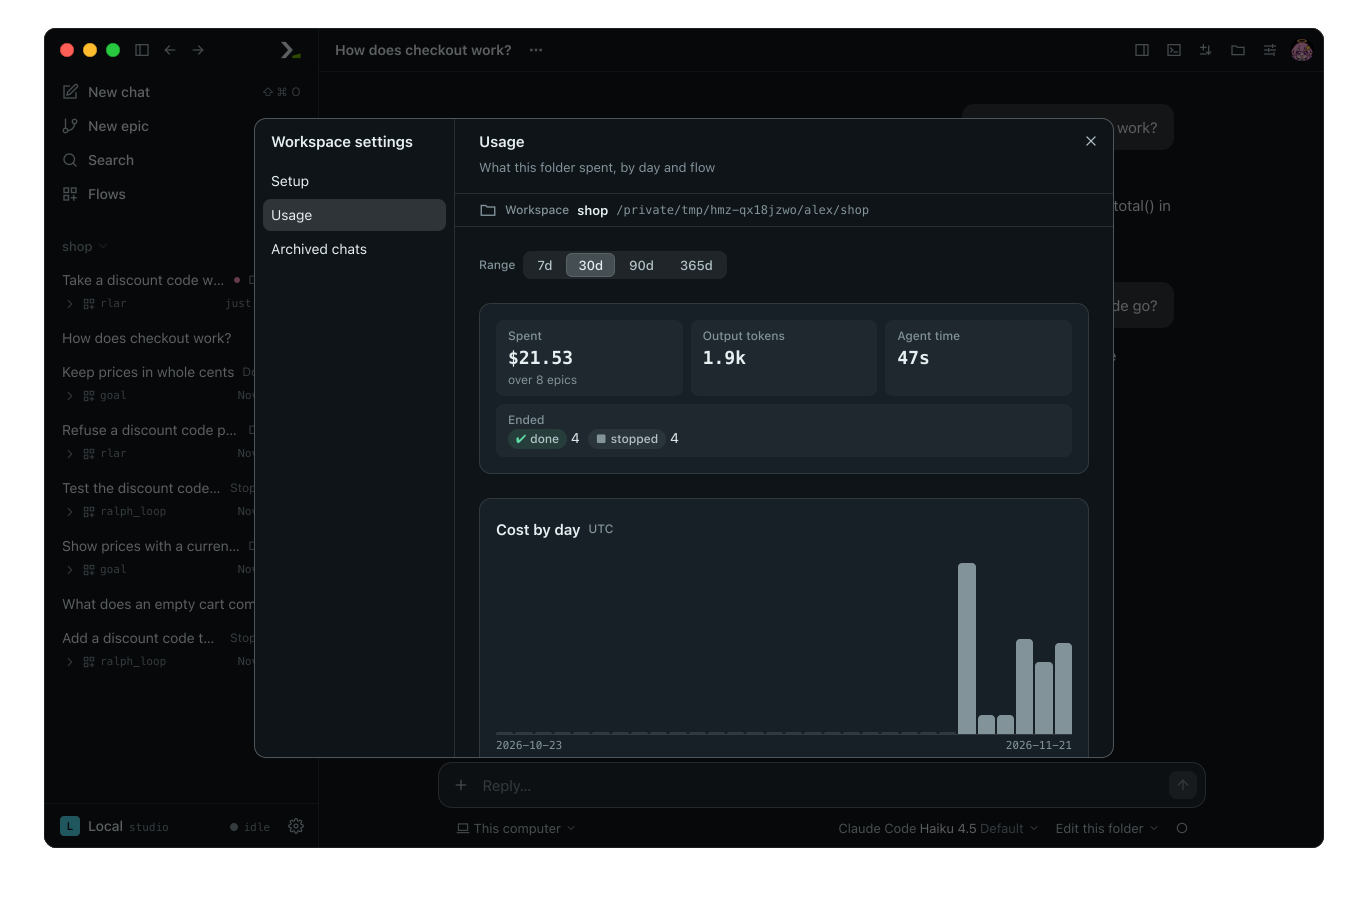
There are two Usage pages with the same layout.
| Page | What it counts | Opens from |
|---|---|---|
| Usage in Settings, under Daemon | Every chat and epic the daemon shown ran, across all folders or none. | Usage in the daemon bar menu at the foot of the sidebar, or Usage settings in the Usage popup when no folder is selected. |
| Usage in a folder's Workspace settings | That one folder, named at the top of the dialog. | Usage in a folder's menu, Workspace settings in its Group and sort menu, or Usage settings in the Usage popup of a chat in a folder. |
| Part | What it shows |
|---|---|
| Range | The lookback window: 7d, 30d, 90d or 365d (default 30 days). This is the only control on the page. |
| Tiles | Spent and epic count, Output tokens, Agent time, and Ended (runs grouped by outcome). |
| Cost by day | One bar per UTC day. Open Table below the chart to see epics, spend and output per day. |
| By flow | One row per flow, ordered by cost: epics, spend, share, output and time. Chats appear under the flow chat. Click a flow name to open Search on its epics, or click chat to open the Chats tab in Search. From the Workspace page, Search is filtered to that folder. |
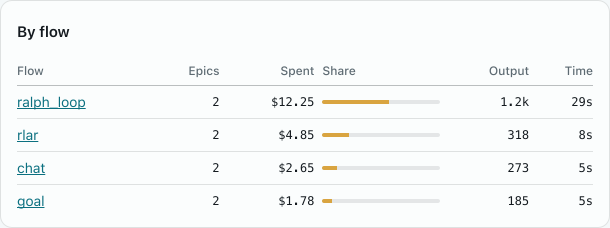
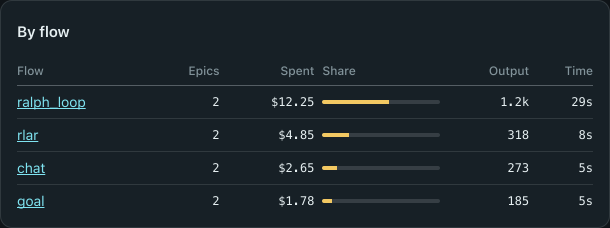
Both pages read chat and epic records directly from the daemon and refresh every 30 seconds. When a range has no runs, the page shows Nothing ran in this range. with a New chat button.
In the terminal
Watch a run
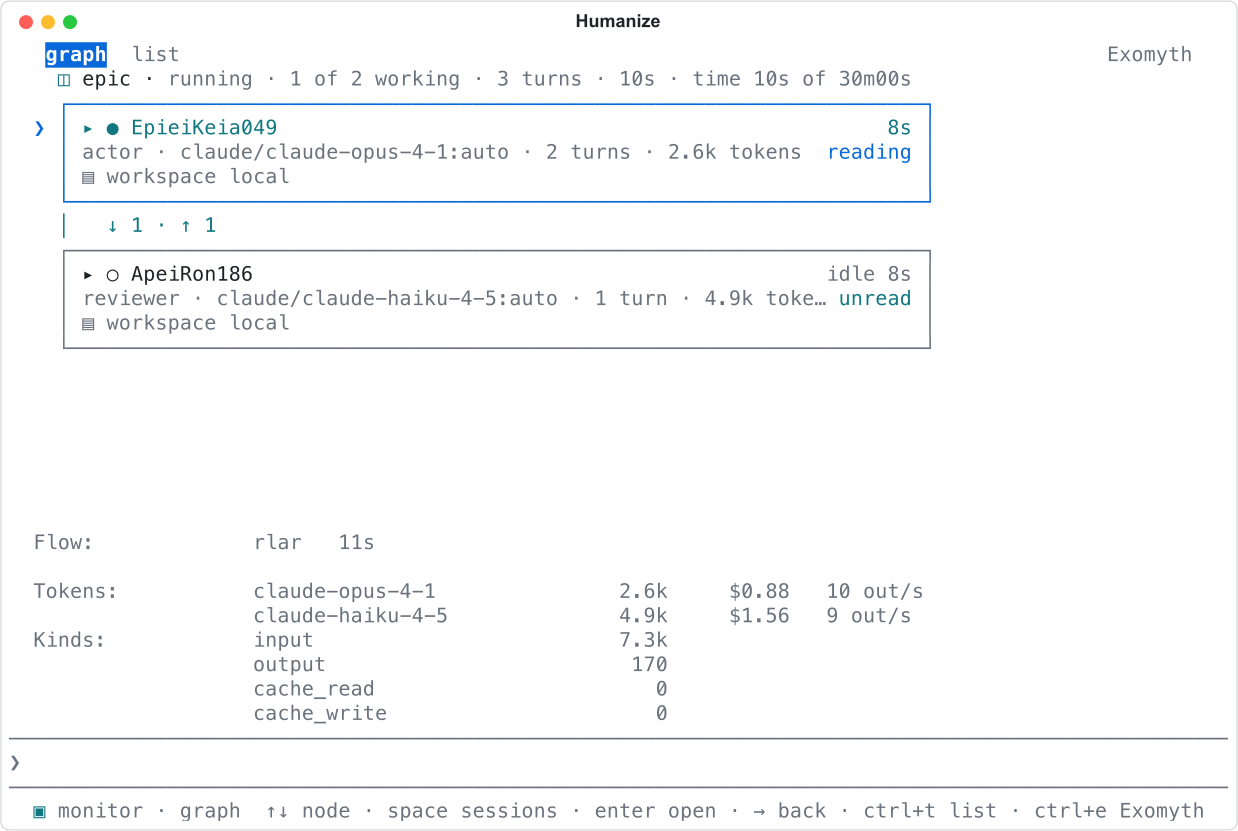
Once an agent spends tokens, two lines appear above the editor and under the agent lines: tokens by kind, then cost and rate.
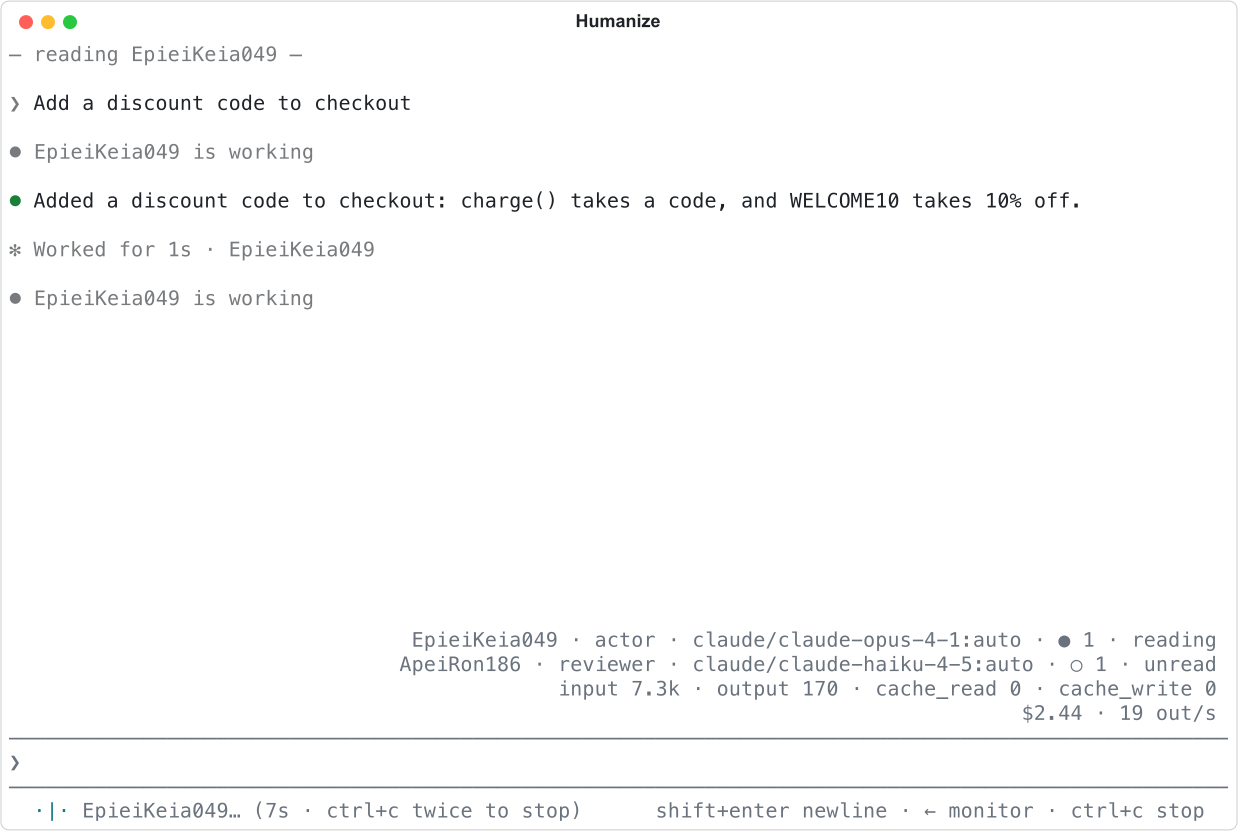
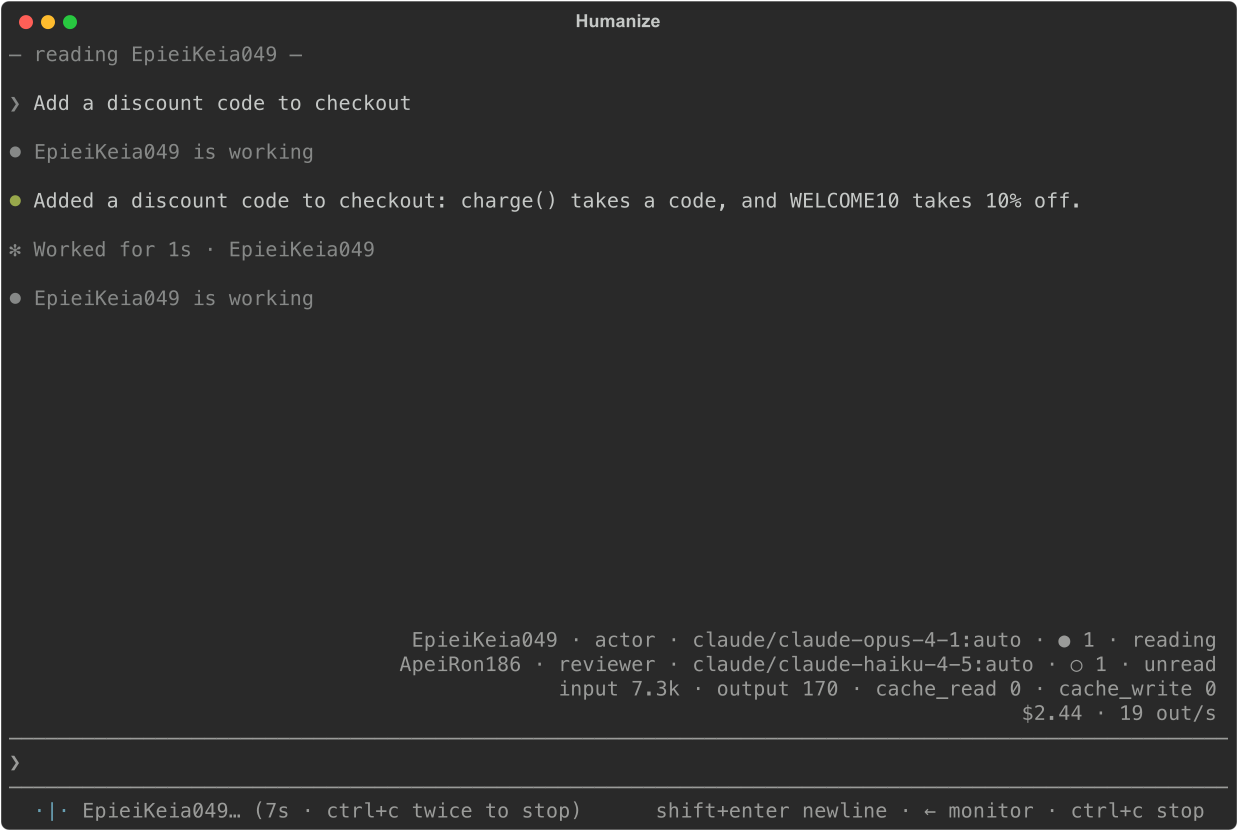
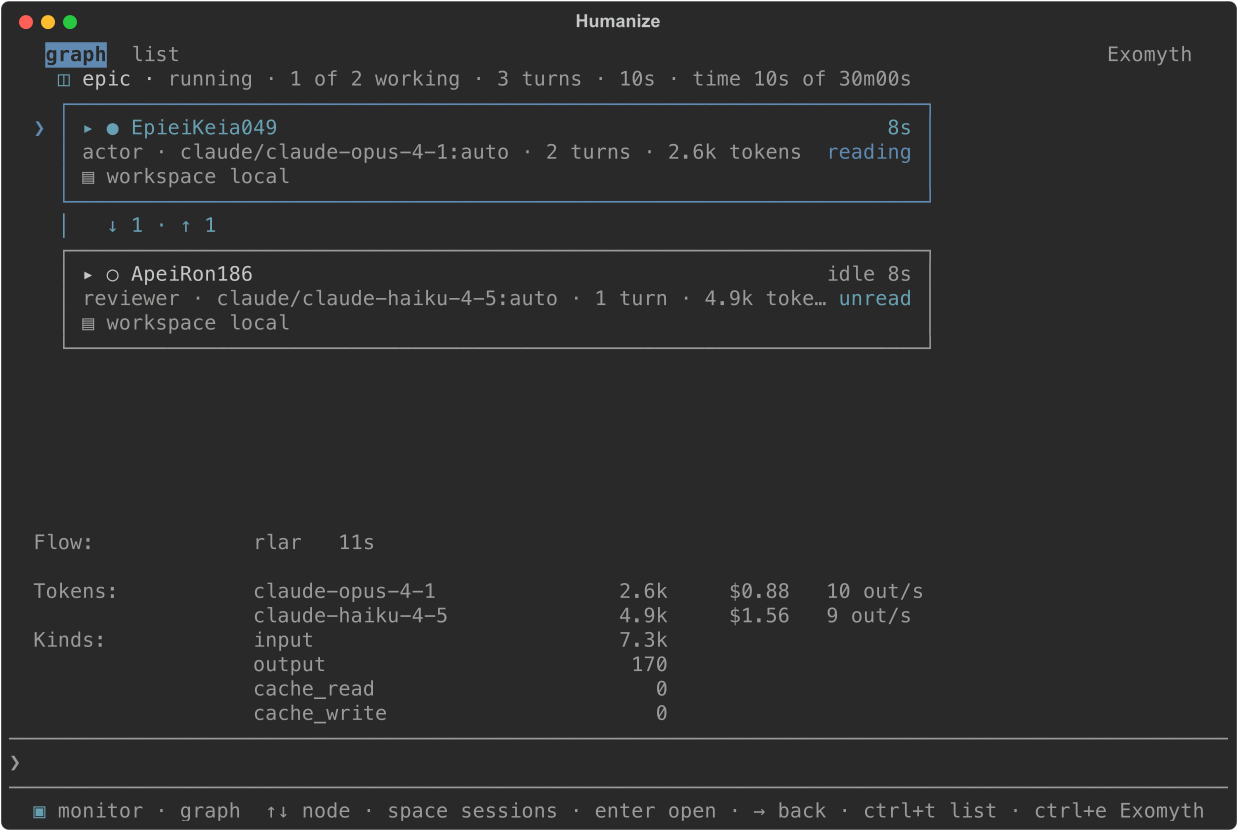
Press left to open the monitor. Under the graph, Tokens lists each model with its tokens, cost, and rate. Kinds lists the tokens of each kind for the whole epic.
View the usage page
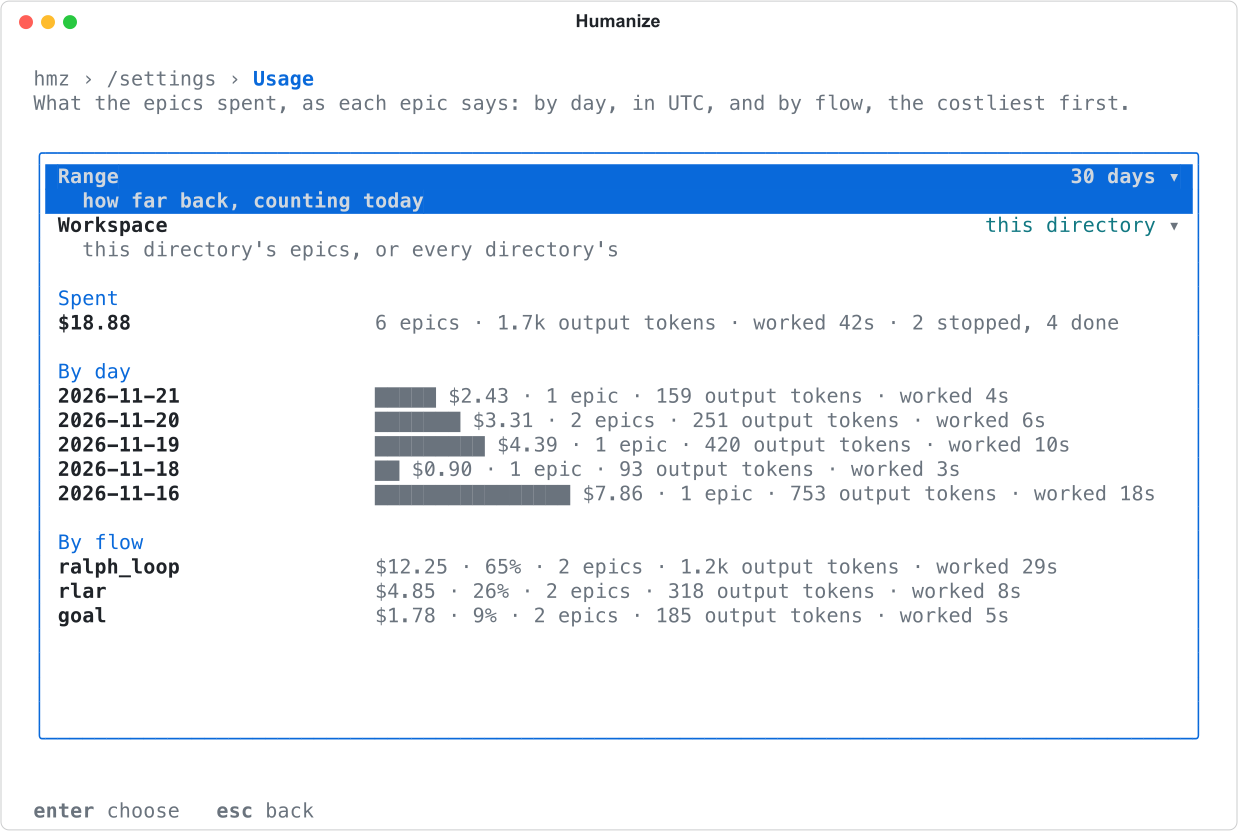
Type /settings usage.
| Row | Choices |
|---|---|
Range | 7 days, 30 days, 90 days or 365 days. Opens on 30 days. |
Workspace | this directory or every directory. Opens on this directory. |
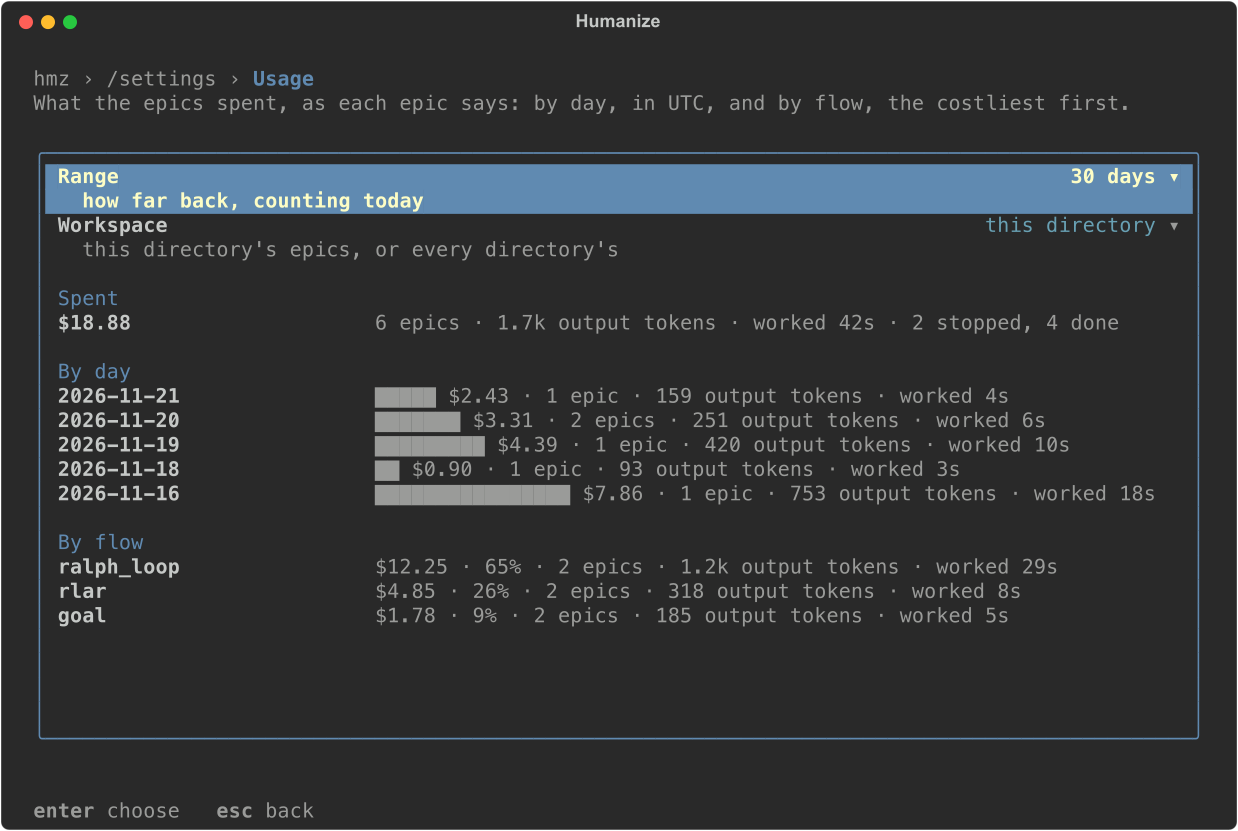
Below the options, you see the total (cost, epics, output tokens, time worked, and how they ended), each UTC day with an epic (newest first), and each flow with its share (costliest first). This page counts epics only, not chats, and has no save button because it stores no settings.
From the command line
Run hmz exec or hmz chat to see a summary line under each turn: tokens by kind, cost (when priced), model, and agent.
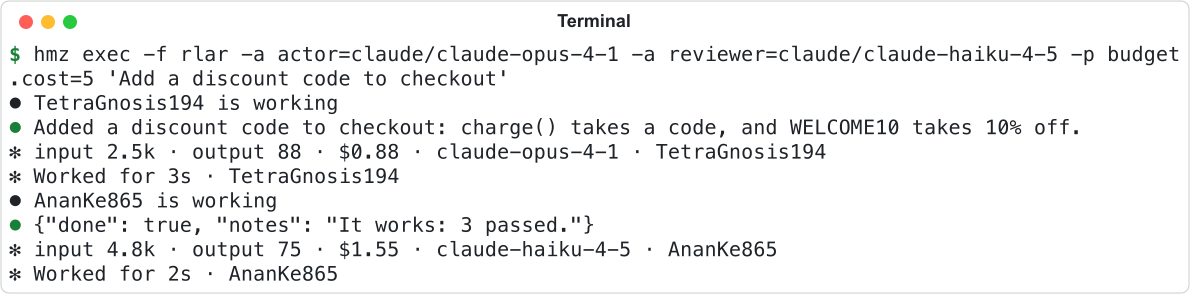
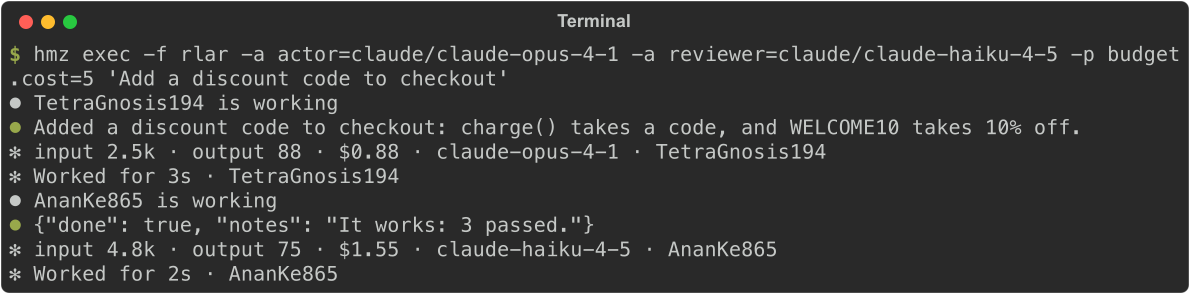
Pass --json to hmz exec to get token counts in the result event of each turn: tokens (by model) and spent (by kind), with no dollar figure. See Events and records.
Prices
Humanize calculates cost at list price from the OpenLLMPrices list (openllmprices.com). It fetches the price list in the background, caches it locally, and refreshes it after 24 hours.
HUMANIZE_PRICES | Effect |
|---|---|
| not set | Fetch the list from OpenLLMPrices. |
| a URL or a file path | Read that list instead. |
off, 0, no, none or empty | Fetch nothing. |
An unpriced model shows tokens and no money, never $0.00. It counts as zero against a cost limit; see Budgets for how Humanize reports this.
Good to know
- Cost is a list-price estimate per token, even on subscription plans, not your provider's bill.
- Reasoning tokens are priced as output. A cache write with no price of its own is priced as input.
- Cost follows the list's dearer rates where they apply. A write to a one-hour cache is priced at the list's one-hour price, and a request whose prompt (input, cached or not) is past a model's long-context line, such as more than 272k tokens, is priced at that tier's rates.
- Unpriced cache reads are excluded, making the total cost a minimum.
- A model is matched to the price list by name, ignoring a release date,
-latest, and a cloud prefix such asbedrock-. - Money formats as
$0.0042under a cent,$1.56from a cent, and$1,234from $100. Tokens format as999,12.3k, and1.25M. Durations format as42s,3m07s, and2h05m. - Every day is a UTC day.
- A run killed before it records its spending counts as a run with nothing spent.